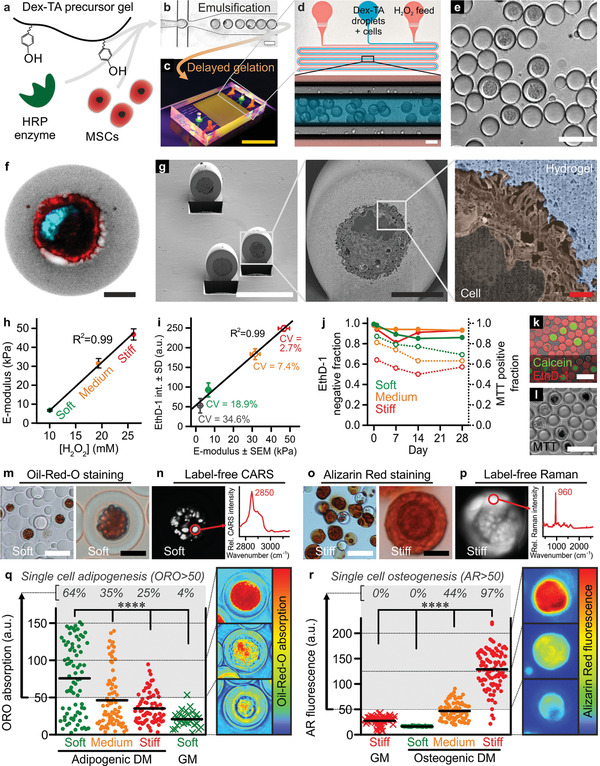
Figure 2.

DOCKING enables engineering of mechanically instructive stem cell niches. a) Dex‐TA, HRP, and MSCs were mixed, b) emulsified using droplet microfluidics, and c,d) reacted using a diffusion‐based H2O2 supplementation platform into e) single‐cell‐laden microgels that could be retrieved by breaking the emulsion. f) Confocal microscopy and g) FIB/SEM (pseudo‐colored) revealed successful encapsulation of individual MSCs in the center of Dex‐TA microgels and suggested that DOCKING resulted in the attachment of cells to the Dex‐TA microgel interior. A single‐cell microgel (f) was labeled with FITC (grey), phalloidin (red), and DAPI (cyan). h) The E‐modulus of microgels could be tuned between ≈5 and 50 kPa and linearly depended on the concentration of H2O2. Error bars indicate ± standard error, n ≥ 32. i) Besides staining nuclei of dead cells, EthD‐1 also stained Dex‐TA and its intensity linearly (R 2 = 0.99) correlated to the microgel E‐modulus. Coefficients of variation (CV = standard deviation/average) of various microgel populations including soft, medium, and stiff ones were determined as a relative measure for inter‐microgel variation within populations. The error bars indicate ± standard error, n ≥ 32, and ± standard deviation, n ≥ 97. j–l) The viable (closed circles) and metabolically active (open circles) cell fractions of in vitro cultured single‐MSC‐laden microgels were determined using live/dead (k) and MTT staining (l). Datapoints indicate average, n ≳ 100. m) In soft Dex‐TA microgels, adipogenic differentiation after 4 weeks of culture in adipogenic differentiation medium (DM) was confirmed using Oil‐Red‐O (ORO) staining and n) label‐free detection of lipids using hyperspectral coherent anti‐Stokes Raman scattering (CARS; characteristic lipid peak at 2850 cm−1). o) In stiff Dex‐TA microgels, osteogenic differentiation after 4 weeks of culture in osteogenic differentiation medium was confirmed using Alizarin Red (AR) staining and p) label‐free detection of calcium phosphates using hyperspectral spontaneous Raman (characteristic phosphate peak at 960 cm−1). q,r) Quantification of the per‐cell adipogenic (q) and osteogenic (r) differentiation as a function of microgel stiffness and culture medium. “GM” indicates growth medium, lines indicate means, n ≥ 27 (q), n ≥ 55 (r), significance is indicated (**** p < 0.0001, Kruskal–Wallis analysis of variance (ANOVA), validated with Mann–Whitney individual sample comparison). The yellow scale bar indicates 1 cm, the white scale bars indicate 50 µm, the black scale bars indicate 10 µm, and the red scale bar indicates 1 µm.
