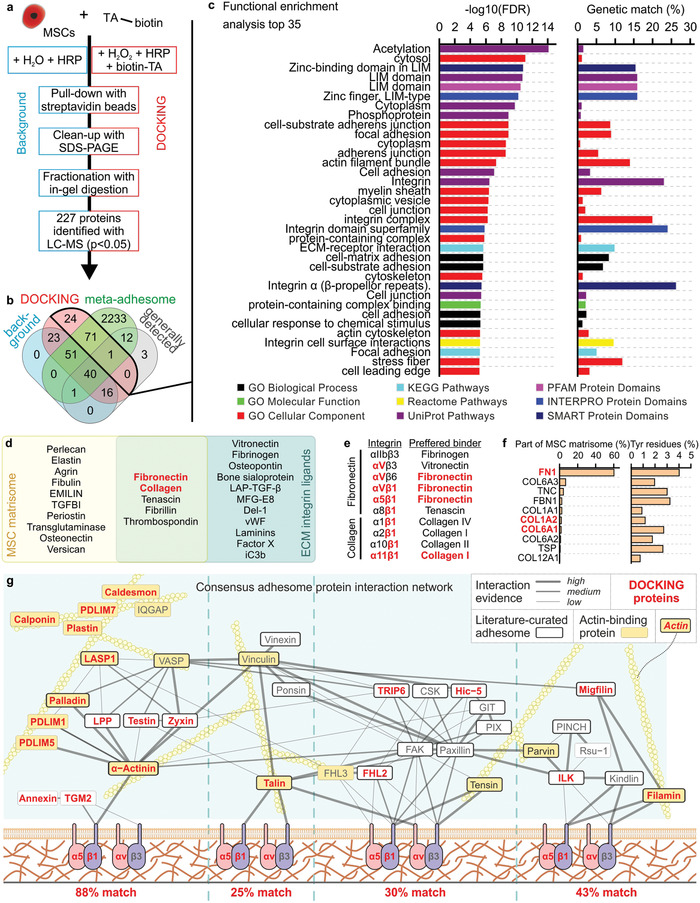
Figure 5.

DOCKING targets the cellular integrin adhesome. a) The summarized protocol for isolating and analyzing cellular proteins targeted by DOCKING. b) Using a Venn diagram, the identified proteins were compared to the meta‐adhesome,[ 56 ] as well as a set of proteins that are generally detected in mass spectrometry.[ 57 ] c) Functional enrichment analysis top 35 of the proteins identified in the DOCKING sample. d) Venn diagram showing a published MSC ECM proteome (i.e., MSC matrisome)[ 59 ] and ECM integrin ligands.[ 60 ] e) Fibronectin and collagen and their binding integrins, as well as the preferred binder of those integrins. f) The relative protein abundance in the MSC matrisome of protein isoforms that have been identified in both the MSC matrisome and reported ECM integrin ligands (i.e., overlap in sub‐panel (d)), followed by a quantification of the percentage of tyrosine residues in those proteins. g) All proteins identified using LC‐MS in the DOCKING sample superimposed on the curated network model of the consensus integrin adhesome protein interaction network. g) Adapted with permission.[ 56 ] Copyright 2015, Springer Nature. Similar to the original network, interactions were manually validated and scored (high, medium, and low) according to the level of experimental evidence for that interaction, as indicated by the thickness and saturation of the grey edges. The thick black node borders indicate literature‐curated adhesome proteins.[ 71 ] The yellow node indicates actin‐binding protein. Actin is depicted for illustrative purposes but is not present in the consensus integrin adhesome. Unconnected components or components with only one low‐evidence interaction are not shown in the network. All proteins in (d–f) that were also identified in the DOCKING sample are indicatedwith red text.
