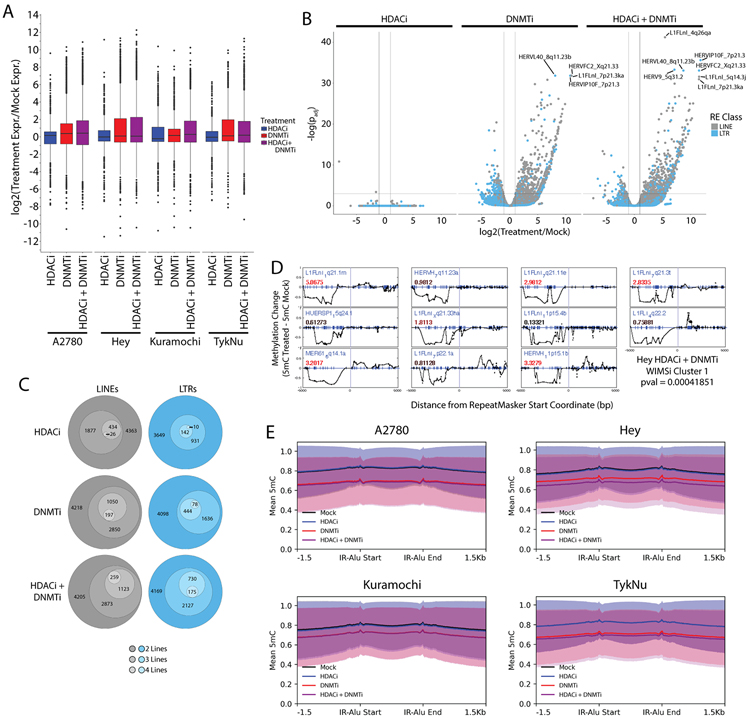
Figure 3: Epigenetic therapies increase transcription of specific LTR and LINE loci.
A) Distribution of the transcription fold-change for individual LTR and LINE loci as determined by Telescope. B) Telescope data volcano plot showing log2(Fold-change) and −log10(DESeq2 padj) for an independent set of three TykNu RNA-seq library replicates. C) Count of upregulated LTR and LINE loci. The innermost group was present in all four OC lines and each circle outward indicates upregulation in one less line. This data is also presented in bar chart form in Supplemental Figure 3. D) Cluster of repetitive element loci that lose methylation over the 5 kb upstream of the start coordinate and are upregulated. Each plot is centered on the LTR or LINE start coordinate, and each dot represents differential methylation at a single CpG (indicated by blue tick marks). Blue text indicates the locus ID. The number in red text indicates the upregulation fold change. Additional WIMSi clusters can be found in Figure S5. E) Metaplots of average methylation values covering the IR-Alus reported by Mehdipour et al. Graphs present mean methylation and shaded areas indicate the standard deviation. HDACi = ITF. DNMTi = AZA.

