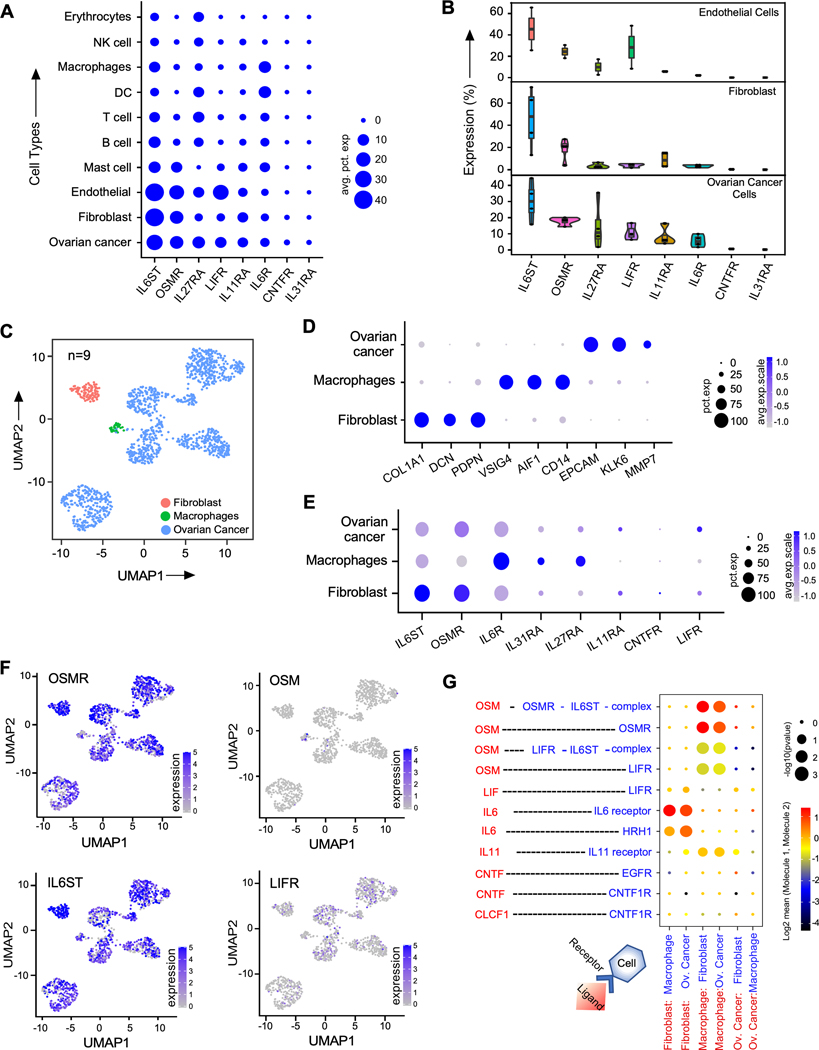
Figure. 1. OSMR is highly expressed in ovarian cancer cells.
A, Dot plot of average across the four 10x datasets of percent of cells expressing IL6 family receptors in different cell types. B, Violin box dot plots demonstrate the distribution of percent of cells expressing IL6 family receptors in ovarian cancer cells, fibroblasts and endothelial cells in the four 10x datasets. C, Different cell types detected in SS2 patient dataset (n=9). Uniform manifold approximation and projection (UMAP) embedding of single cells (dots), colored by cell types. D, Cell-type specific markers in SS2 dataset showing their prevalence and strength of expression. E, Expression of IL6 family receptors in the different cell types in SS2 dataset. F, UMAP embedding of single cell colored (blue color) by expression of OSM, OSMR, and IL6ST. G, Ligand-receptor interactions detected for the IL6 family ligands (red color) and receptors or receptor complex (blue color) between the different cell types in SMART-seq2 scRNA-seq data (SS2) dataset. Size of dots represent percentage abundance of IL6 family receptors in the respective cell type.

