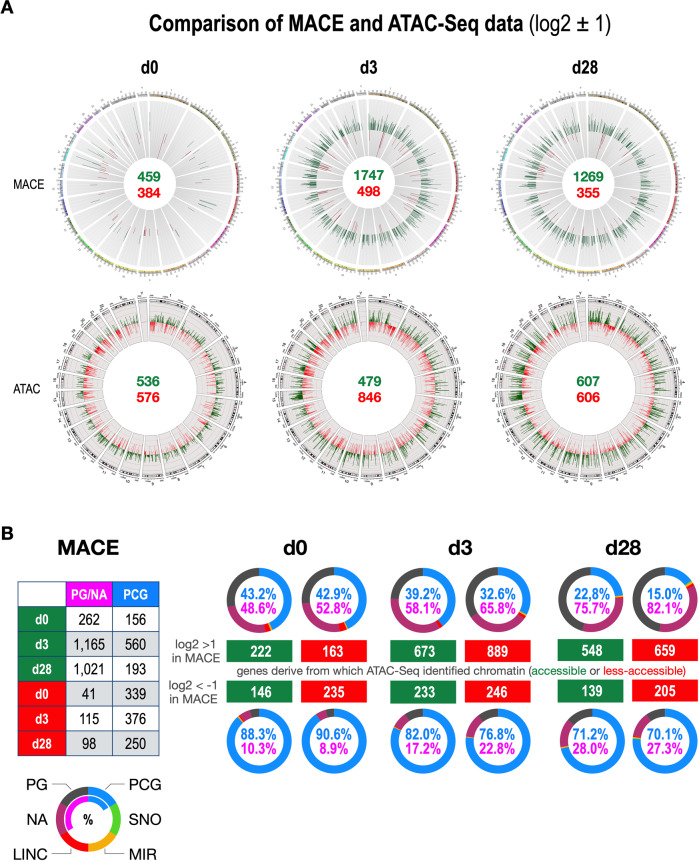
Fig. 3. Comparing MACE- and ATAC-Seq data of the t(4;11) model system in Circos plots and DAGT module analysis.
A Comparison of the genome-wide MACE- with ATAC-Seq data visualized for day 0, day 3, and day 28. It shows the number of deregulated genes in MACE experiments, as well as the changes in chromatin accessibility in the ATAC-Seq experiments. B. Left Table: summary of deregulated gene classes (pseudogenes/non-annotated genes (PG/NA)) versus protein-coding genes (PCG) for up and downregulated genes with a log2 values of ±1. Right part: Pseudogene/non-annotated genes (pink numbers) were compared to PCG’s (blue numbers) by indicating their percentages in each circle plot. Numbers in the green and red rectangles show e.g., that the up- or downregulated genes and their origin from accessible or less accessible chromatin fragments. This type of analysis was performed for all 12 subsections.

