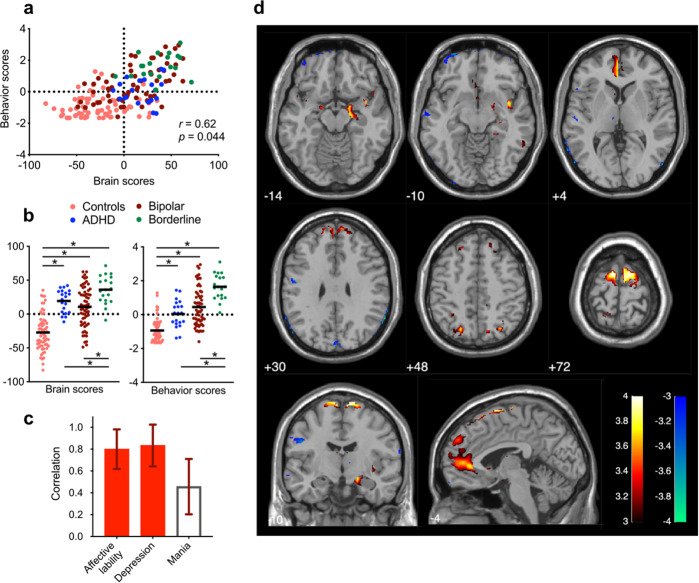
Fig. 1. The first latent component (LC1) is characterized by high emotion dysregulation.
a PLS correlation between individual brain and behavior scores for LC1. Each dot is a participant from any of the four diagnostic groups. b Group differences in brain and behavior scores for LC1. Bold lines are mean scores for each group, while asterisks indicate two-sample t-tests that have survived to FDR correction (q < 0.05). Controls have significantly lower brain and behavior scores compared to all patient groups. BPD patients have significantly higher brain and behavior scores compared to ADHD and BD patients. c Greater depression and affective lability characterize the behavioral pattern of LC1 (see Table S1). Mania did not have a strong contribution to LC1 (z < 3). Loadings are Pearson’s correlations between participants’ original behavioral data and their behavior scores, and error bars indicate bootstrap-estimated standard deviations. d LC1 is characterized by increased BOLD signal variability in the left ventromedial PFC, bilateral dorsomedial PFC, subgenual ACC, bilateral amygdala, right hippocampus, right insula, and bilateral motor cortex, as well as decreased BOLD signal variability in occipital regions (see Table S2 for MNI coordinates of peaks of all significant clusters). Loadings are z-scores obtained from bootstrapping, thresholded at absolute values ≥3 (p < 0.01).

