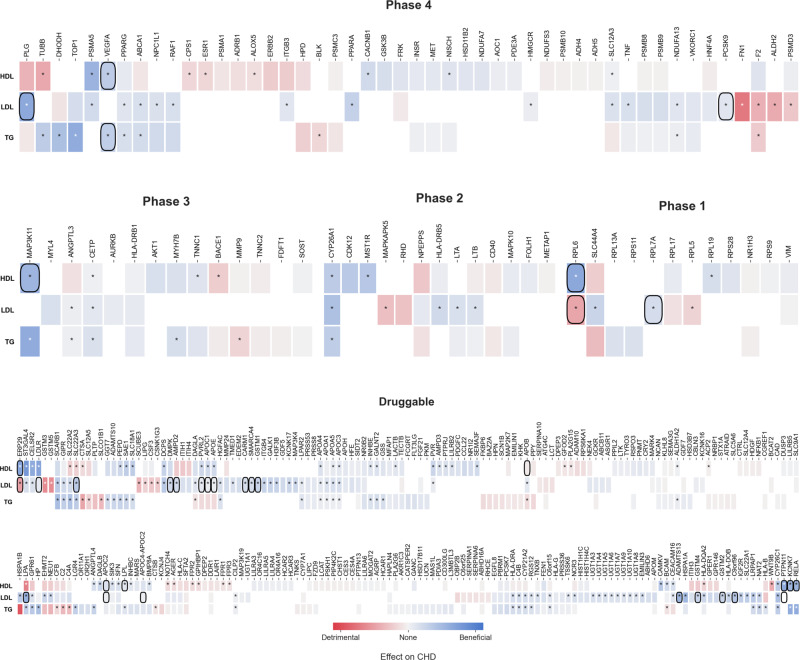
Fig. 2. Discovery drug target MR estimates on CHD.
Analyses were performed using genetic associations with LDL-C, HDL-C, and TG from the Global Lipid Genetic Consortium (GLGC) with CHD events from the CardiogramPlusC4D Consortium. Drug targets are grouped by clinical phase according to the ChEMBL database. Blue indicates a beneficial effect on CHD risk and red a detrimental effect per SD difference with respect to the indicated lipid sub-fraction. Significant estimates are indicated with an asterisk (*). Co-localization of genetic effects on the relevant lipid sub-fraction and CHD at the same locus is indicated by a square around the cell.

