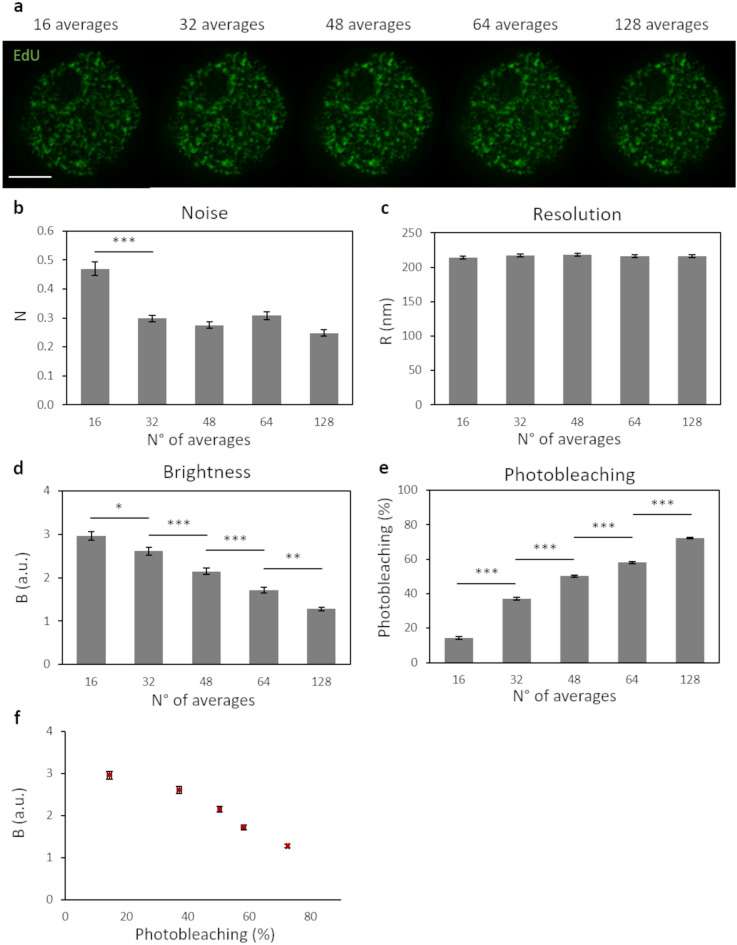
Figure 3.
Increasing number of scans average per line. (a) Representative images of U937-PR9 cells upon staining of DNA replication foci. Each image is obtained by combining and averaging STED images after each acquisition step of increasing number of line-averages (see “Methods” for a detailed description of acquisition settings) Scale bar represents 3 µm. (b–d) Quantification of Resolution, Brightness and Noise parameters in function of the number of line-averages by application of the QuICS algorithm. At least ten images for each condition have been acquired. (e) Quantification of Photobleaching in function of the number of line-averages. Photobleaching was calculated as the percentage reduction of average fluorescence intensity with respect to the initial value. (f) Representation of the Brightness variation in function of the Photobleaching. At least ten images for each condition have been quantified. Error bars represent the SEM and ***p < 0.001, **p < 0.01, *p < 0.05.

