Figure 4.
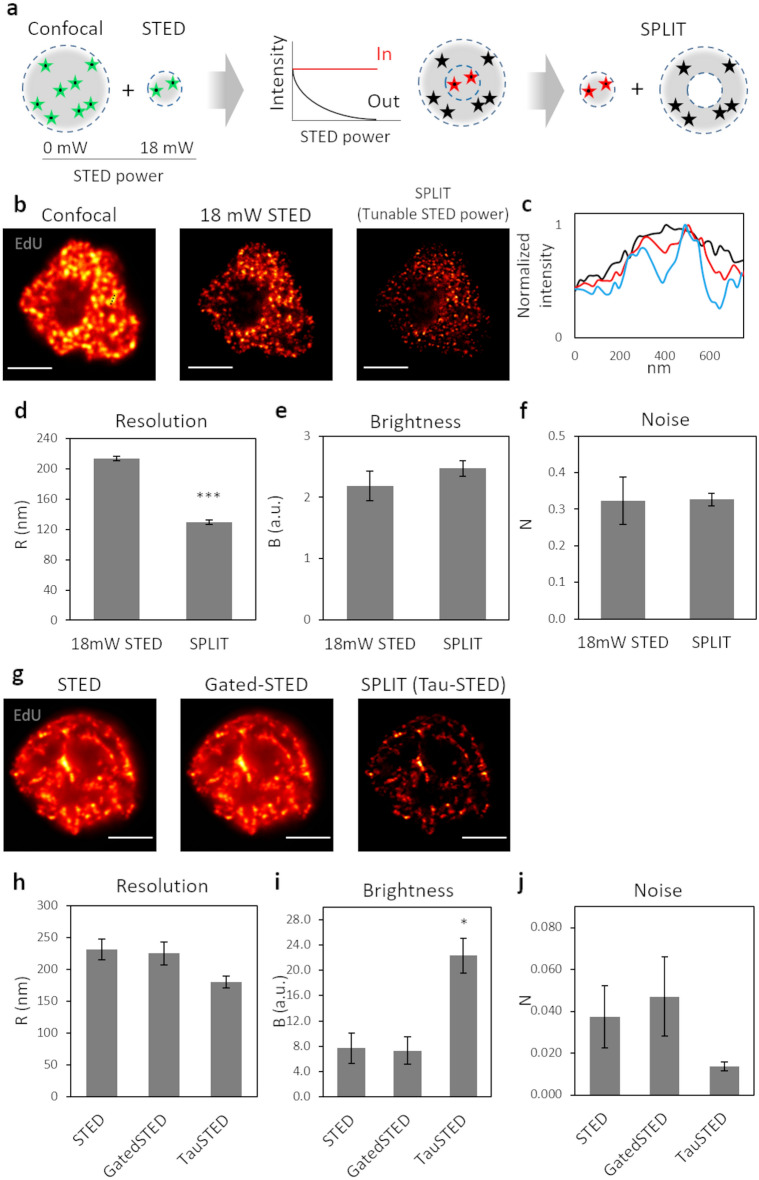
Comparison between SPLIT and STED imaging. (a) Schematic representation of the SPLIT principle using a tunable STED depletion power. The sequential acquisition with an increased STED depletion power from 0 to 18 mW, allow to obtain the extra information about the fluorescence depletion dynamics of photons arising from the center (in) and the periphery (out) of the PSF. (b) Representative images of U937-PR9 cells upon staining of DNA replication foci. Sequential acquisition of a confocal image (STED depletion power: 0 mW) and a STED image with a 18 mW depletion beam, followed by the resulting SPLIT image. Scale bars represent 3 µm. (c) Comparison between the line profiles of the same structure in the confocal (black line), the STED (red line) and the SPLIT (blue line) images of (b). The measured structure is defined by a black dotted line in the confocal image. (d–f) Quantification of Resolution, Brightness, and Noise parameters by application of the QuICS algorithm. At least ten 18 mW STED images have been acquired and compared to the resulting SPLIT images. Error bars represent the SEM and ***p < 0.001. (g) Images of U937-PR9 cells upon staining of DNA replication foci through incorporation of EdU labeled with Alexa azide 594. Images acquired with the Leica Stellaris 8 Tau-STED microscope. Shown are the raw STED image, the gated-STED image with a time-gating of 1–8 ns and the Tau STED image. Scale bars represent 3 µm. (h–j) Quantification of Resolution, Brightness, and Noise parameters of images shown in (g) by application of the QuICS algorithm. Error bars represent the SEM and *p < 0.05.

