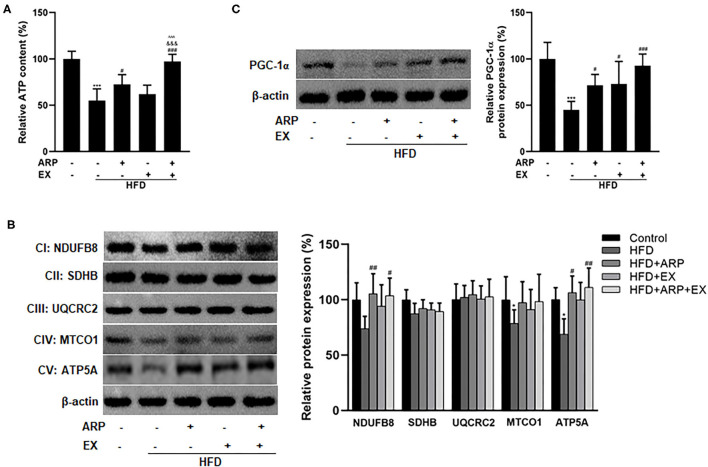
Figure 6.
Effects of ARP and EX mitochondrial biogenesis in HFD-fed mice. (A) Liver ATP content. Liver expression of PGC-1α (B) and mitochondrial complexes subunits (C) (left, western blot image; right, statistical analysis). All the values are exhibited as mean ± SME, n = 8. *p < 0.05 and ***p < 0.001 vs. related control group; #p < 0.05, ##p < 0.01, and ###p < 0.001 vs. related HFD group; ∧∧∧p < 0.001 vs. related HFD+AR group; &&&p < 0.001 vs. related HFD+EX group.

