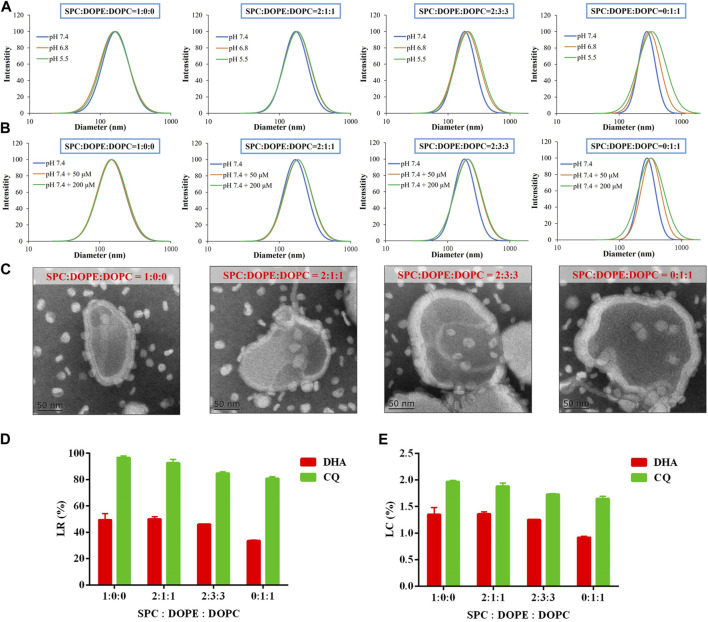
FIGURE 1.
Preparation and optimization of LNP/DC with respect to SPC/DOPE/DOPC ratio. (A, B) Size distribution of LNP/DC prepared at various weight ratio of SPC/DOPE/DOPC in pH 7.4, 6.8, 5.5 (A) and pH 7.4 + 50/200 μM-H2O2 (B) medium. (C) TEM images of LNP/DC prepared at various weight ratio of SPC/DOPE/DOPC (Scar bar reads 50 µm). (D) LR and (E) LC of DHA and CQ for LNP/DC prepared at various weight ratio of SPC/DOPE/DOPC. Each bar represents the mean ± SD (n = 3).

