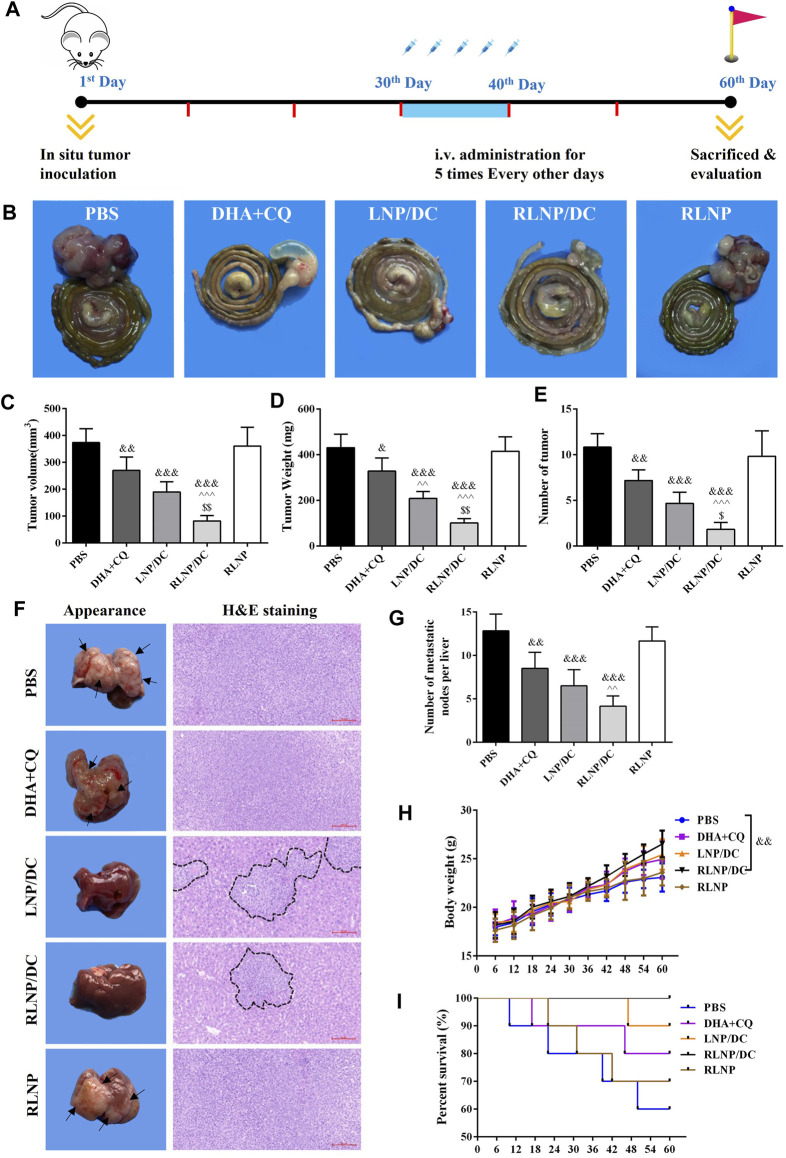
FIGURE 7.
Evaluation of in vivo anti-proliferation and anti-metastasis effects in a mouse model of orthotopic metastasis of colorectal cancer. (A) Schematic illustration of in vivo experiments involving therapeutic regimen. (B) Representative images of colorectum from each group. (C –E) Measurement of tumor volume (C), tumor weight (D), and number of tumor (E) on day 60. (F) Representative images of liver and H and E staining (×200) of metastatic tissue section from each group. Arrowheads indicate the metastatic nodes on the appearance of liver and black imaginary lines mark the contractible margin of metastasis nodes. (G) Quantitation of the number of metastatic nodes on liver. (H) Body weight of the nude mice. (I) Survival rate of mice from each group. Each bar represents the mean ± SD (n ≥ 6). & p < 0.05, && p < 0.01, and &&& p < 0.001 vs. Ctrl; ^ ^ p < 0.01 and ^^ ^ ^ p < 0.001 vs. DHA + CQ; $ p < 0.05 and $$ p < 0.01 vs. LNP/DC.

