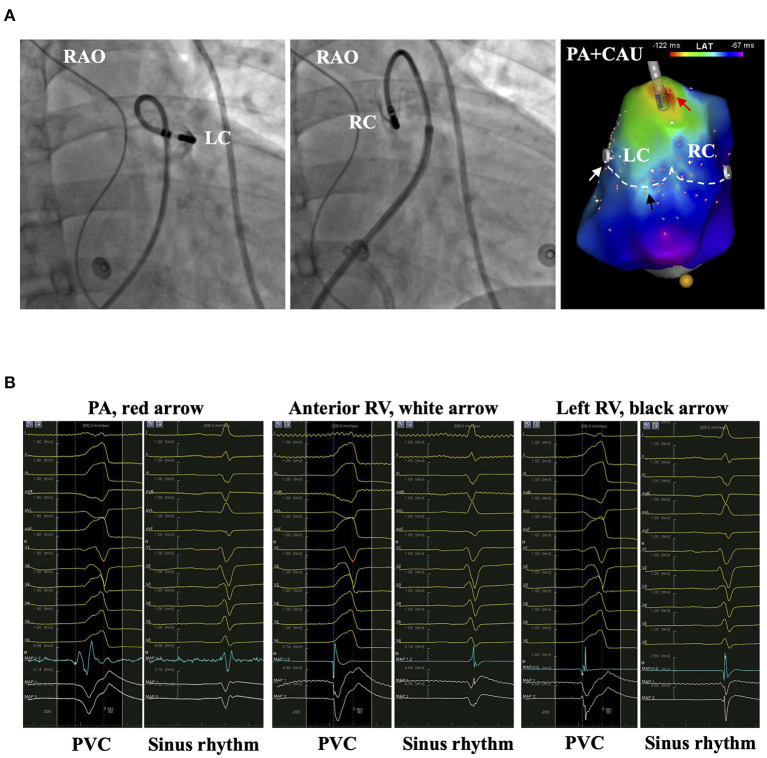
Figure 9.
The representative patient with PVC originating from PA. (A) The left and middle panels show the bases of LC and RC by injecting contrast from the irrigation tube of the catheter. The right panel shows the activation mapping. The white dashed line denotes the PVVJ. The red arrow marks the EVA site 18.6 mm above PVVJ. White and black arrows mark the relative early ventricular activation site at the anterior and left RV. (B) The panels show the electrograms in PVC and sinus rhythm recorded at the arrow-denoted sites from left to right. The red dashed line denotes the time point of reference. The yellow dashed line denotes the LAT. EVA, earliest ventricular activating; LAT, local activating time; LC, left cusp; PVC, premature ventricular contraction; PVVJ, pulmonary valve–ventricle junction; RC, right cusp.

