FIGURE 2.
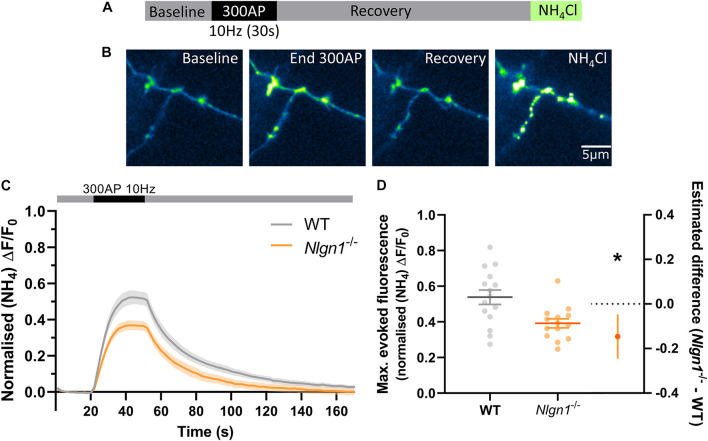
Nlgn1–/– synapses display a change in the balance of exocytosis and endocytosis. Nlgn1–/– and WT neurons transfected with sypHy were stimulated with 300 action potentials at 10 Hz, and change in fluorescence monitored over time. Neurons were then perfused with NH4Cl to reveal total sypHy fluorescence. (A) Overview of experimental paradigm. (B) Representative images of relative sypHy fluorescence at baseline, following 300 action potentials (end 300 AP), 120 s after cessation of stimulus train (recovery), and following perfusion with NH4Cl. Scale bar indicates 5 μm. Images are false coloured to show relative sypHy fluorescence, with warmer colours indicating increased fluorescence intensity. (C) Time trace of mean (± SEM) changes in sypHy fluorescence, normalised to total fluorescence. (D) Peak sypHy fluorescence during stimulus train, normalised to total fluorescence. Scatter plots show individual n, bars indicate mean ± SEM. Forest plot shows estimated difference between group means with 95% CI, unpaired t-test, *p < 0.05 (p = 0.0055).N = 14–15 individual fields of view from independent coverslips.

