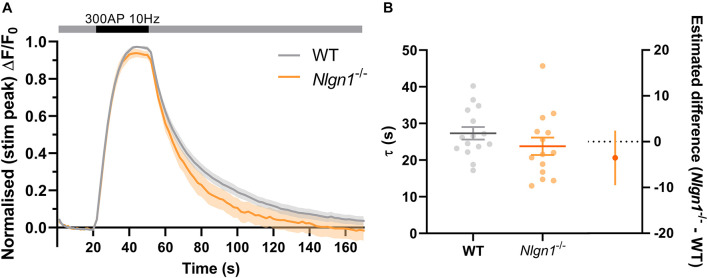
FIGURE 4.
Loss of Nlgn1–/– does not impact post-stimulus compensatory endocytosis. Nlgn1–/– and WT neurons transfected with sypHy were stimulated with 300 action potentials at 10 Hz, and change in fluorescence monitored over time. (A) Time trace of mean (± SEM) changes in sypHy fluorescence, normalised to peak fluorescence during stimulus train. Mixed model ANOVA with Sidak’s multiple comparison test, p > 0.05 across all time points. (B) Mean (± SEM) endocytic decay time constant (tau, s) from single exponential decay curve fit to data following end of stimulus train (from Figure 2A). Scatter plots show individual n (single coverslip average), bars indicate mean ± SEM. Forest plot shows estimated difference between group means with 95% CI, unpaired t-test, p = 0.2332. N = 14–15 individual fields of view from independent coverslips, as in Figure 2.

