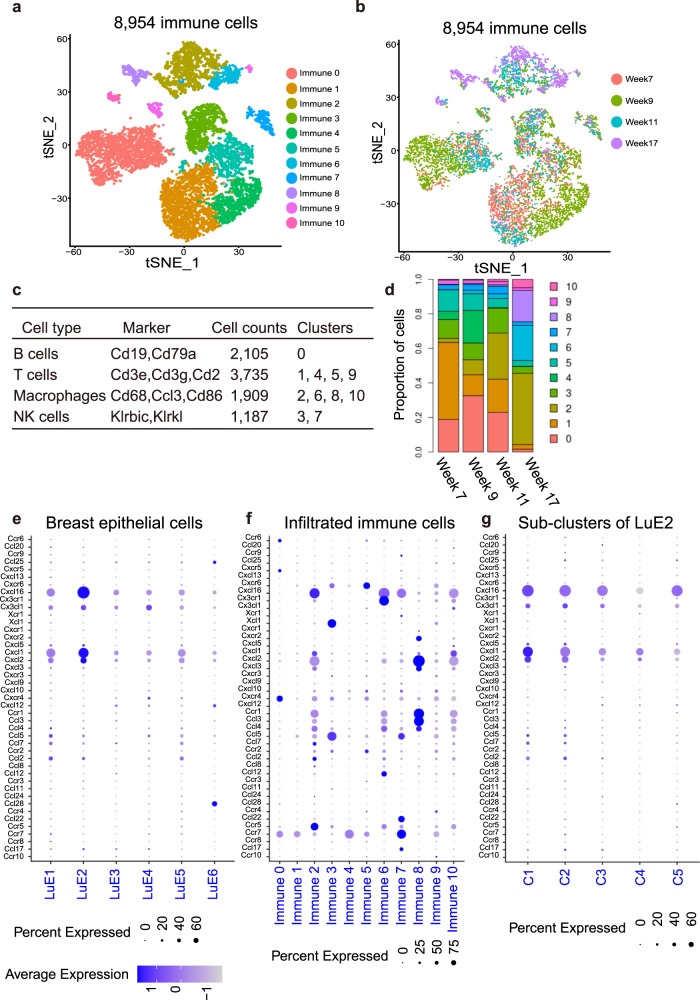
Fig. 7. The cross-talk between BCSCs and immune cells during tumor progression.
a, b The t-SNE plot showed the distribution of the immune cells from different clusters supervised by Seurat (a) and different tumor progression stages (b) in the atlas. c A table showed the markers used to annotate immune cells and cell accounts of the corresponding cell type. d Dynamic changes of the proportion of the immune cell types spanning from premalignant to late carcinoma. e–g Dot plots showed the expression of paired cytokine and cytokine receptors in ERlow clusters, immune clusters and sub-clusters of LuE2, which indicated that cytokine Cxcl1 and Cxcl16 were highly expressed in sub-clusters of LuE2 and the corresponding receptors Cxcr2 and Cxcr6 were highly expressed in macrophages and T cells.

