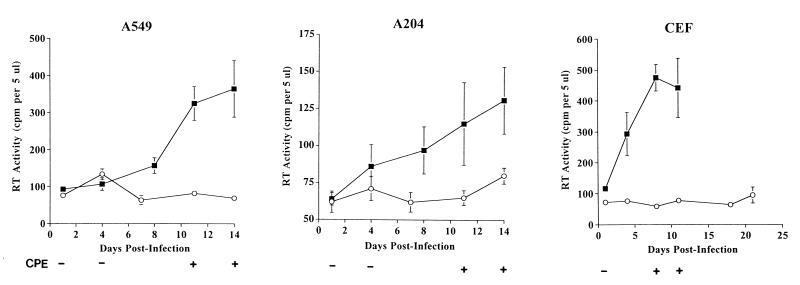
FIG. 2.
Kinetics of SFV-2 replication in human and chicken cells. A204, A549, and CEF cells were inoculated with SFV-2 at an eightfold greater concentration than that used in the experiment described in the legend to Fig. 1. RT activity was detected in filtered supernatants of SFV-2 infected cells (■). Parallel uninfected cells were the negative control (○). The CPE at various time points is indicated as negative (−) or positive (+). The infection was done in a single experiment; the RT data are the means ± SDs (error bars) for two independent RT assays in which each sample was spotted in duplicate.

