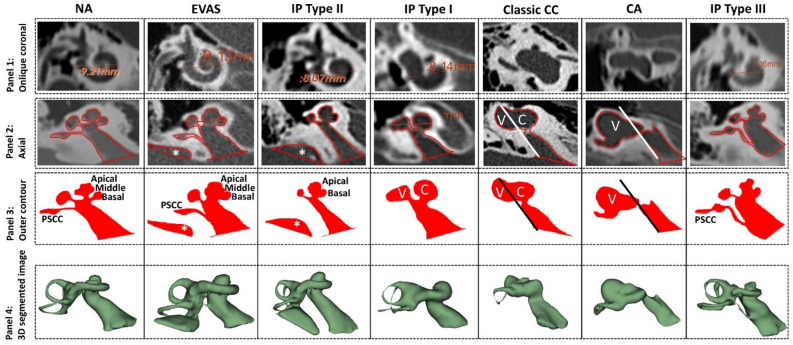
Figure 2.
Sample data from every anatomical type in the oblique coronal view showing the A-values is shown in panel 1. Axial view showing the outer contour of the inner ear drawn manually (panel 2) and the captured outer contour filled with color (panel 3). The A-value is not measurable in the classic common cavity (CC) and vestibular cavity anatomical types. The straight line drawn parallel to the posterior edge of internal auditory canal differentiates the cochlear (C) from the vestibular portion (V) in classic CC and shows only the presence of V in the CA anatomical type. The asterisk (*) refers to the enlarged vestibular aqueduct seen in enlarged vestibular aqueduct syndrome (EVAS) and the incomplete partition (IP) type II. The 3D segmented image of the inner ear allows, performed following the procedure of Dhanasingh et al.4, gives a better understanding of how the inner ear structures look (panel 4). The 3D segmentation images are not to scale.

