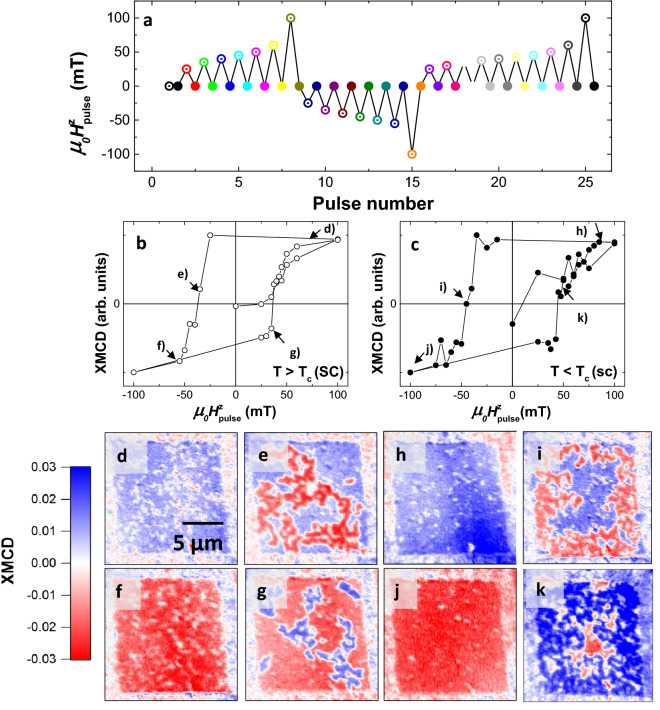
Figure 2.
(a) Sketch of the magnetic pulse history followed at 120 K. XMCD imaging takes always place after pulse end (full dots). (b,c) XMCD averaged over the whole square structure vs Hzpulse within the normal (T > TC, (b)) and superconducting (T < TC, (c)) state of the YBCO square. (d–g) XMCD images at selected Hzpulse (see arrows in panel b) for T > TC. (h–k) XMCD images at selected Hzpulse (see arrows in (c)) for T < TC. Above TC domain nucleation takes place at random positions while at for T < TC it is confined at edges.

