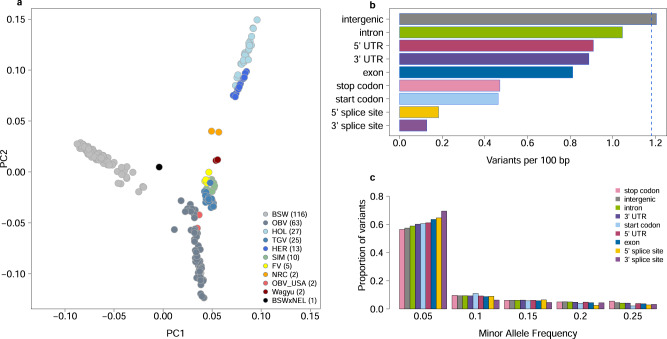
Fig. 1. Constraints on well-annotated features uncovered from a large bovine variant catalogue.
Plot of the first two principal components (PC) of genomic relationship matrix among 266 cattle used to establish the variant catalogue. Individuals are colored according to breeds (BSW Brown Swiss, OBV Original Braunvieh, HOL Holstein, TGV Tyrolean Grey, HER Hereford, SIM Simmental, FV Fleckvieh, NRC Norwegian Red Cattle, NEL Nellore). Values in parentheses indicate the number of samples per breed (a). Variation (b) and allele frequency spectrum (c) within nine annotated genomic features. Variation is expressed as the number of variable nucleotides per 100 bp of the feature. The blue dotted line indicates the average genome-wide variation. Difference in variation was statistically significant (Fisher’s exact test; p < 3.87 x 10⁻⁵) between all pairs of features except between start and stop codon.

