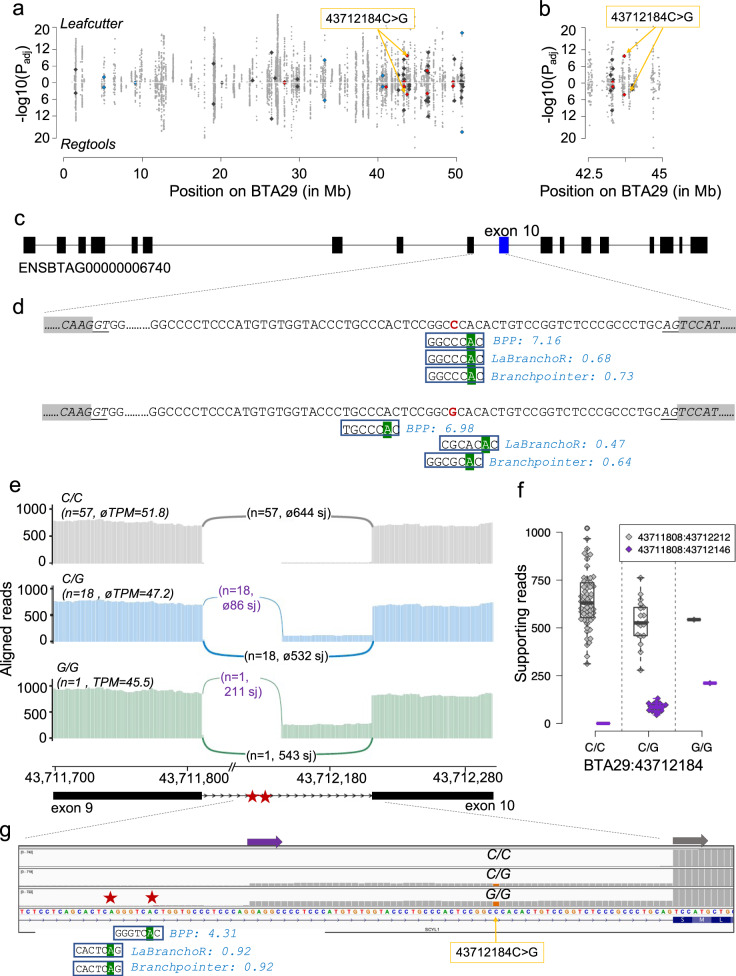
Fig. 8. A mutation within a predicted branch point sequence is associated with alternative 3’ splicing of SCYL1 exon 10.
Manhattan plot of cis-acting splicing quantitative trait loci on chromosome 29. Intron excision ratios were calculated based on exon junctions that were extracted from RNA sequencing read alignments using either Leafcutter or RegTools. Orange arrows indicate the BTA29:43712184C > G variant. Red, blue, and dark-grey symbols represent variants affecting the fourth, sixth and all other positions of the heptamer, respectively (a). Detailed view of the region encompassing the BTA29:43712184C > G variant (b). Structure of the bovine SCYL1 gene (ENSBTAG00000006740). Boxes represent exons Boxes represent exons (c). Branch point sequences predicted in SCYL1 intron 9. The BTA29:43712184 C allele (red colour) resides within a heptamer encompassing a “CNA” motif that was consistently and confidently placed at the same location by all three tools. Green background highlights the predicted branch point. Numbers reflect scores predicted by the different tools. The branch point was either placed at a different location (BPP, LaBranchoR) or predicted with less confidence (branchpointer) for the intronic sequence with the BTA29:43712184 G allele (d). Sashimi plots of RNA sequencing coverage and splice junction (sj) utilization in 76 animals of the sQTL cohort for different BTA29:43712184 genotypes (grey: C/C, blue: C/G, green: G/G). The abundance of SYCL1 mRNA in testis tissue is indicated in transcripts per million (TPM). Arcs indicate splice junction reads, with the thickness of the arc representing the average number of reads spanning the two exons. Values in parentheses indicate the number of samples (n) for each genotype as well as the average number of junction-spanning reads (e). Boxplots and beeswarm plots of the number of reads supporting the primary (grey) and alternate (purple) splice junctions (sj) (f). Representative IGV screenshots of the RNA sequencing alignments for three animals with different BTA29:43712184 genotypes. Grey and purple arrows represent alternative exon starts. Red stars indicate putative branch point sequences predicted upstream the alternative start of exon 10 at 43,712,146 bp (g).

