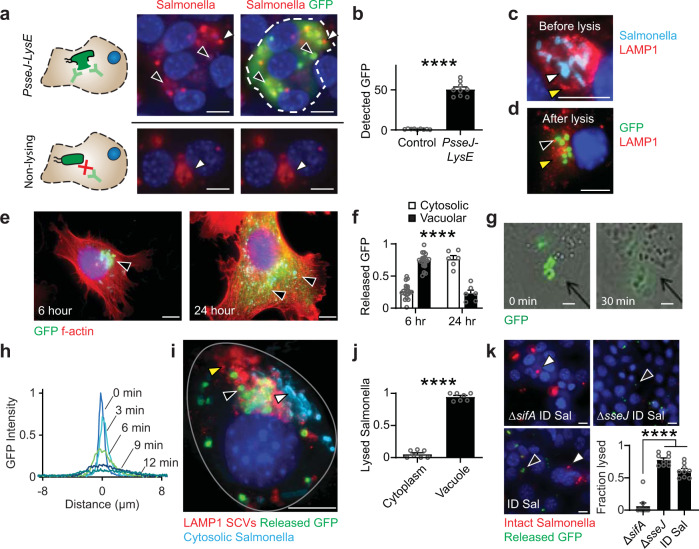
Fig. 3. Release of delivered proteins from SCVs.
a Selective permeabilization of cancer cell membranes enabled detection of released GFP. After administration to cells at an MOI of 10, ID Salmonella (top) released GFP (green, black arrows). Intact bacteria (red, white arrows) are easily discernable from the membranes of lysed bacteria (faint red, black arrows). In cells administered nonlysing Salmonella that produced GFP (bottom), only intracellular bacteria (red, white arrows) and no GFP was detected. b The amount of GFP detected in cultures administered ID Salmonella was fifty times greater than nonlysing controls (P < 0.0001; n = 9). c After invasion and before lysis, Salmonella (light blue, white arrow) are in LAMP1-stained SCVs (red, yellow arrows). d After lysis, GFP (green, black arrow) is retained within the membranes of SCVs (red, yellow arrow). e In phalloidin-stained cancer cells (red), released GFP (green, black arrows) moved from SCVs near the nucleus (blue) to throughout the cytoplasm. f From 6 to 24 h after invasion, the percentage of released GFP in the cytosol increased from 25 to 75% (P < 0.0001; n = 21 at 6 h and n = 6 at 24 h). g The lysis of individual ID Salmonella released GFP that diffused through the cytosol of a cancer cell (see Supplementary Movie 1). h Temporal profiles of GFP intensity, centered on the lysed bacteria. i Salmonella in LAMP1-stained SCVs (red, yellow arrow) lysed and released GFP (green, black arrow). Cytosolic bacteria (light blue, white arrow) did not lyse. j Most lysed bacteria, identified by colocalized staining for Salmonella and released GFP, were located within LAMP1-stained SCVs (P < 0.0001; n = 7). k Predominantly cytoplasmic ΔsifA ID Salmonella remained intact (red, white arrows) and lysed less (green, black arrows) than predominantly vacuolar ΔsseJ ID Salmonella and ID Salmonella (P < 0.0001; n = 9). Data are shown as means ± SEM. Statistical comparisons in b, f, and j are two-tailed, unpaired Student’s t-tests. The statistical comparisons in k were to a single control performed with ANOVA followed by Dunnett’s method. Two outliers were removed from ΔsifA using the ROUT method with a Q of 1%. Asterisks indicate significance (****P < 0.0001). Images in a, c, d, i, and k are representative of 9, 25, 7, 18, and 9 independent biological samples. Images in e are representative of 21 and 6 independent biological samples at 6 and 24 h, respectively. The images in g are frames from Supplementary Movie 1. Scale bars in a, c–e, i, and k are 10 µm, and in g the scale bars are 1 µm.

