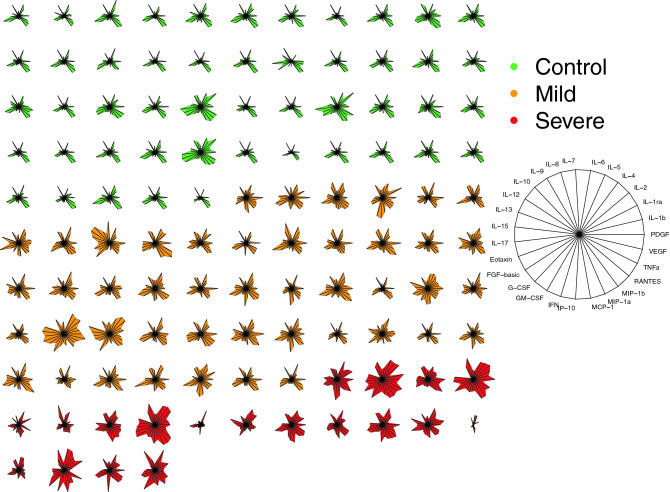
Figure 2.
Cytokine-based pattern of COVID-19 patients. Star plot obtained by multivariate data analysis of whole cytokinome of every subject consists of a sequence of equi-angular spokes (radii), with each spoke representing one cytokine as indicated in figure legend on the right. Data length of a spoke is proportional to the magnitude of the variable for the data point relative to the maximum magnitude of the variable across all data points. A line is drawn connecting the data values for each spoke.

