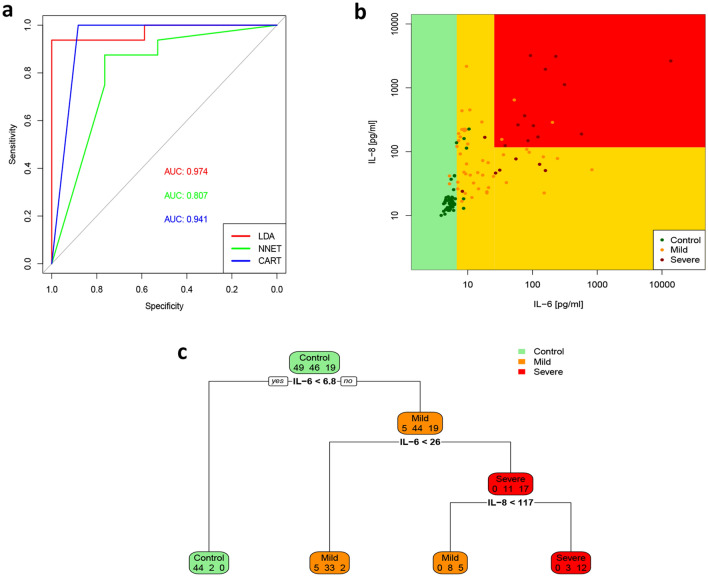
Figure 5.
IL-6 and IL-8 performance in discriminating COVID-19 disease and severity. Comparison of classification accuracy of LDA, NNET and CART algorithms. AUC of ROC analysis indicates performance of the three classifier algorithms (A). Scatterplot from CART analysis identifies the groups labelled by their terminal nodes (B). The decision tree shows the rules and split points to estimate COVID-19 disease and severity. In each box, the first number estimates controls, the second number estimates mild COVID-19 patients, the third number severe COVID-19 patients. Decision binary tree reveals an optimal cut-off of IL-6 > 6.8 pg/ml for predicting COVID-19 disease and of IL-8 > 117 pg/ml for severity (C).

