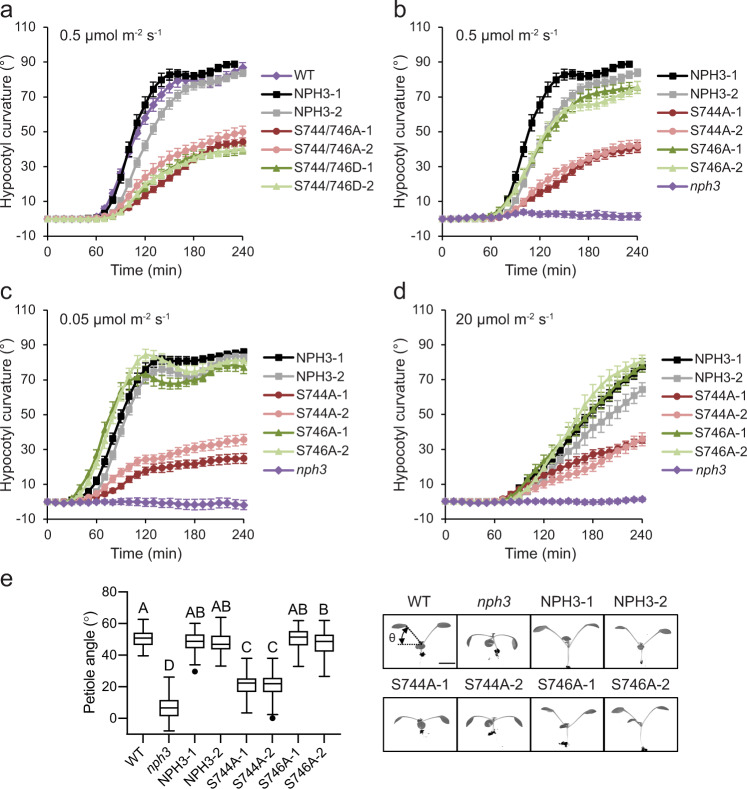
Fig. 6. Phot1 phosphorylation of NPH3 promotes functionality.
a Phototropism of etiolated wild-type (WT) seedlings, nph3 seedlings expressing GFP-NPH3 (NPH3) or phosphorylation site mutants S744A S746A and S744D S746D irradiated with 0.5 µmol m−2 s−1 unilateral blue light. b–d Phototropism of etiolated nph3 seedlings expressing GFP-NPH3 (NPH3), phosphorylation site mutants S744A or S746A and nph3 mutant seedling irradiated with b 0.5 µmol m−2 s−1, c 0.05 µmol m−2 s−1 or d 20 µmol m−2 s−1 unilateral blue light. Hypocotyl curvatures were measured every 10 min for 4 h, and each value is the mean ± SE of 17–20 seedlings from two independent biological replicates. Exact n values are provided in the Source data file. e Petiole positioning of WT, nph3 mutant and nph3 seedlings expressing GFP-NPH3 or phosphorylation site mutants S744A and S746A. Plants were grown under 80 µmol m−2 s−1 white light for 9 d before transfer to 10 µmol m−2 s−1 white light for 5 d. Box and whisker plots show petiole angle from the horizontal measured for the first true leaves. The centre line indicates the median, the bounds of the boxes indicate the 25th and 75th percentiles, whiskers extend 1.5 times the interquartile range and outliers are represented by dots. (n = 60 seedlings, from three independent biological replicates). Different letters denote significant differences (P < 0.01, one-way ANOVA with Tukey post test). Exact P values are provided in the Source data file. Representative images for each genotype are shown on the right. Bar, 5 mm.

