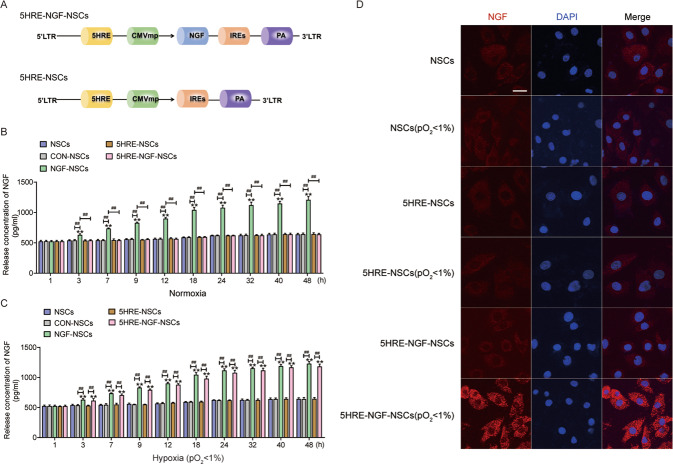
Fig. 1. The establishment and authentication of adeno-associated virus-II loaded 5HRE-NSCs and 5HRE-NGF-NSCs.
A A schematic plot of constructs of adeno-associated virus-II loaded 5HRE-NSCs and 5HRE-NGF-NSCs. B, C Release concentration of NGF under control and hypoxia(pO2 < 1%) conditions. Levels of NGF exhibited by ELISA. ** notes P < 0.01 versus NSCs group, ## notes P < 0.01 and # notes P < 0.5. Data are the mean values ± SD, n = 6. D Staining of NGF and nucleus, in NSCs, 5HRE-NSCs, 5HRE-NGF-NSCs and corresponding hypoxia (pO2 < 1%) groups, showing the NGF (red), nuclei (blue) in vitro. Scale bar = 50 μm.

