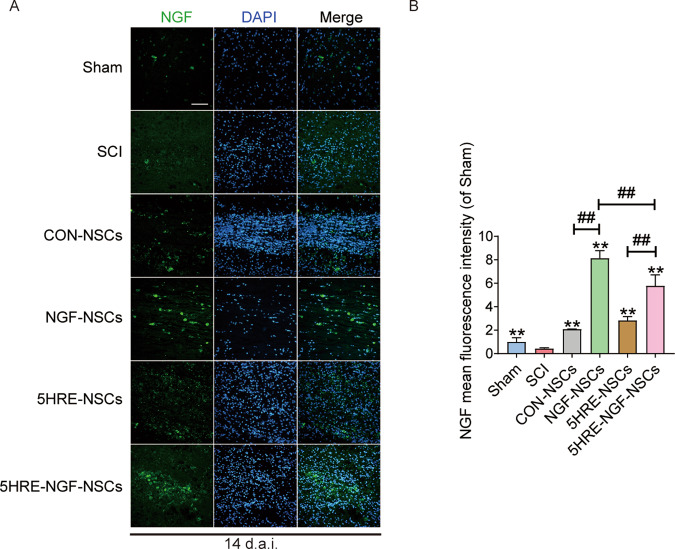
Fig. 2. NGF-NSCs group and corresponding hypoxia regulated expressed the higher NGF than other groups, as the former was the highest at the day of 14.
A NGF staining of the Sham, SCI, CON-NSCs, NGF-NSCs, 5HRE-NSCs, and 5HRE-NGF-NSCs group. The light green parts are NGF+ stained neurons, the nuclei are labeled by DAPI (blue). Magnification was ×20. B Analysis of positive cells in immunofluorescence staining. ** signify P < 0.01 versus the SCI group, ## signify P < 0.01. Data are the mean values ± SD, n = 6.

