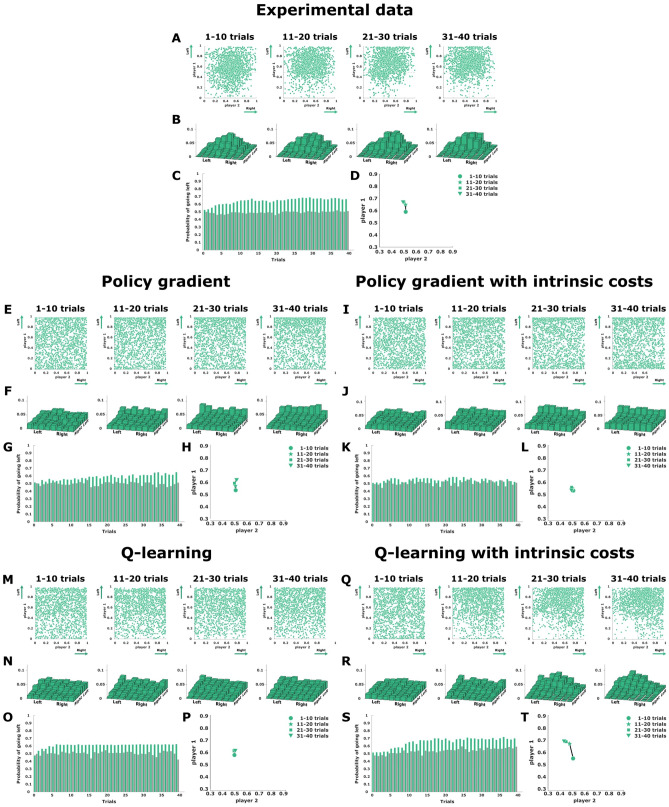
Figure 4.
Asymmetric matching pennies. (A),(E),(I),(M), and (Q) show final decisions as a scatter plot in the -plane, where subjects’ actions are expected to cluster in top quadrants. (B),(F),(J),(N), and (R) show a two-dimensional histogram binning of the experimental scatter plots. (C),(G),(K),(O), and (S) present the change of the mean endpoint (independently for each player) for each trial across the block of 40 trials. (D),(H),(L),(P), and (T) show the direction of adaptation in the endpoint space. The experimental data is shown on the top, the four continuous models are below. Created using MATLAB R2021a (https://www.mathworks.com)43.

