Figure 1.
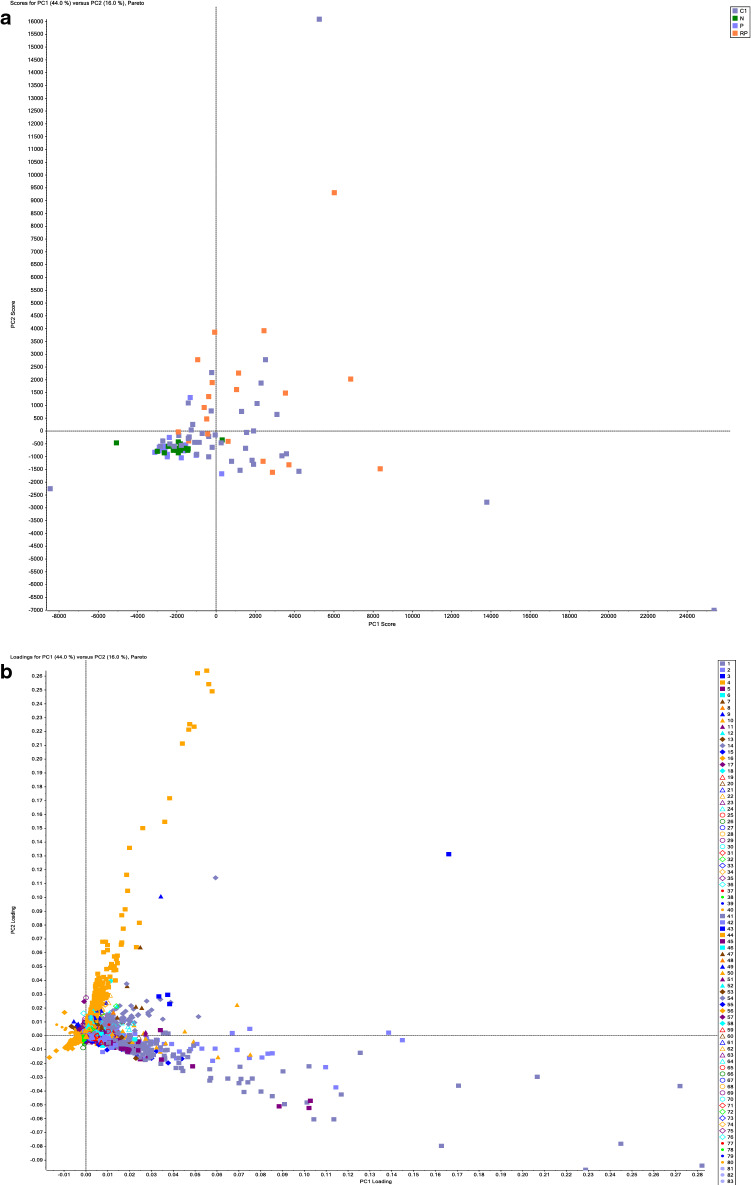
Metabolomics analysis of plasma samples. (a) Scoring plots from PCA model analysis of the full-scan MS analysis for classifying COVID 19 infected (dark purple and orange squares) and control groups (light purple squares: uninfected male, green square: uninfected female). and (b) loading plots from PCA model analysis in which each metabolite is represented by a distinct color as shown in the graph legend (c) Profile of an identified regulated metabolite, via loading component analysis, as represented by peak area across COVID-19-infected and control samples, such metabolites drives the observed separation seen between the cohorts in a PCA model analysis, using MarkerView software by SCIEX. COVID 19 infected (dark purple and orange squares) and control groups (light purple squares: uninfected male, green square: uninfected female).


