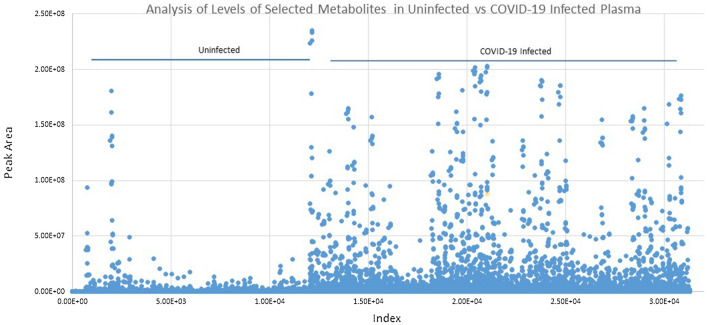
Figure 2.
COVID-19 infection and abundance of selected metabolites. A comprehensive over view of levels, as measured by peak area, of metabolites in COVID-19-infected and control samples as measured by LC–MS/MS IDA analysis utilizing the m/z inclusion list provided from the loading component of PCA analysis. Each spot represents a metabolite as defined in the inclusion list, the Y axis represents the peak area detected for each m/z ion across the analyzed uninfected and COVID-19-infected samples X- axis.

