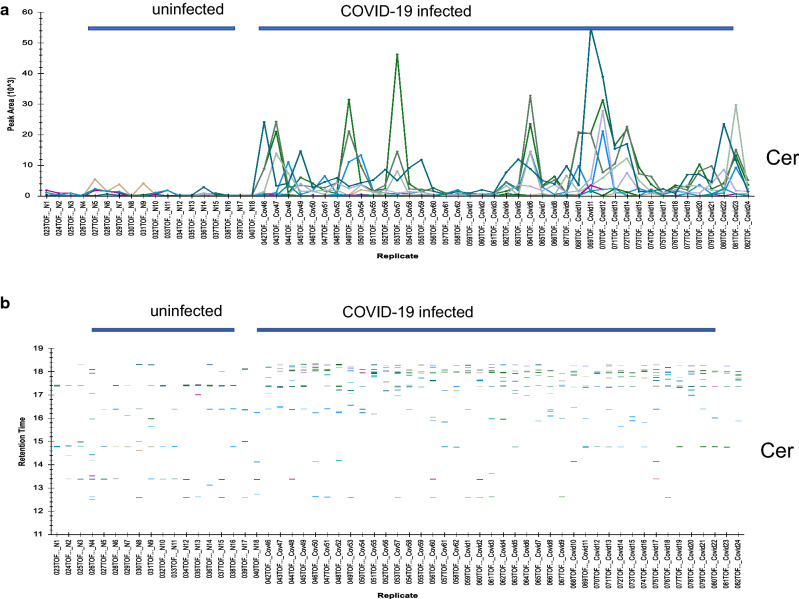
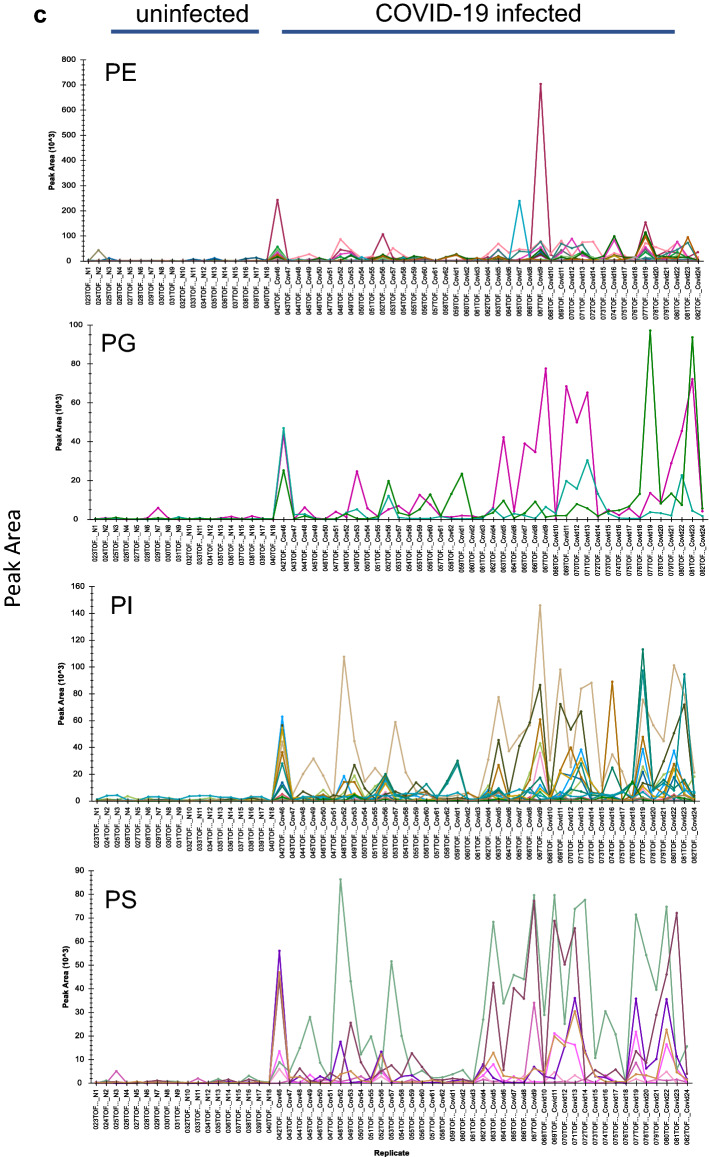
Figure 3.
Grouping of identified COVID-19 infection-dependent metabolites into lipid classes. Comparative abundance profile of the identified subclasses of lipids per class in the plasma of uninfected and COVID-19-infected individuals. An over view of levels, as measured by peak area (Y- axis), of metabolites in COVID-19-infected and control samples as measured by LC–MS/MS IDA analysis. Each color line represents a metabolite as defined in the inclusion list, grouped into lipid subclass, and lipid class. (a) Analysis of observed changes in peak area of subclasses of the Cer (Y-axis) in uninfected (samples N1–N18) and COVID-19-infected plasma samples (X-axis, Samples Covid1–24, Covid 46–62). (b) Changes in the observed retention time of the subclasses of Cer across all samples. (c) Analysis of observed changes in peak area of subclasses of the PE, PG, PI, and PS class (Y-axis) in uninfected and COVID-19-infected plasma samples (X-axis). Each metabolite defined in the inclusion list is represented in a different color.


