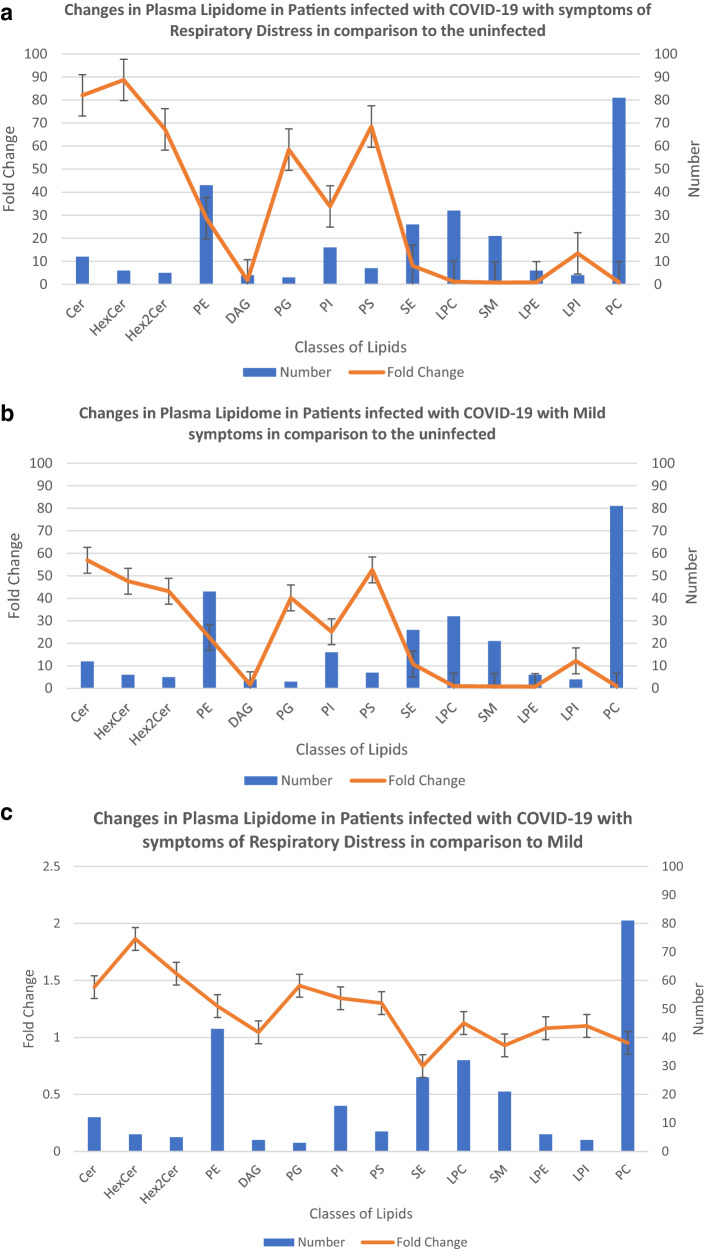
Figure 4.
Effect of Covid-19 infection on Plasma Lipidome. Metabolites identified to be different lipid subclasses are segregated based on their class (X-axis), the number of members of each class identified in the plasma of COVID-19 infected individuals is represented (Y-axis). The fold sum of MEDM changes in peak areas, shows average change in levels of the identified lipid class as you go from the uninfected to infected with COVID-19 with respiratory distress symptoms (a), and to infected with mild symptoms (b). The comparative differences between the lipid classes in plasma of individuals with COVID-19 infection with mild vs respiratory distress symptoms are monitored (c). Error bars represent, standard deviation of replicates.

