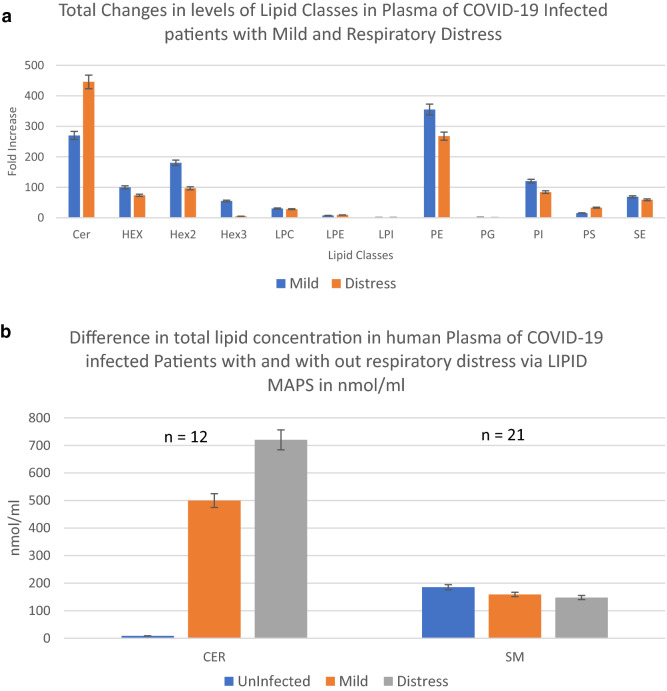
Figure 5.
Total Levels of Ceramide class of lipids in Plasma of the Covid-19 infected. Fold sum of MEDM changes of peak area times number of subclasses identified per lipid class. (a) An overall estimation of relative changes in the concentrations of various lipid classes. (b) Relative concentration of lipids per class in μmoles/l of plasma as determined via the SRM 1950 consensus LIPID MAPS consortium. Error bars represent, standard deviation of replicates.

