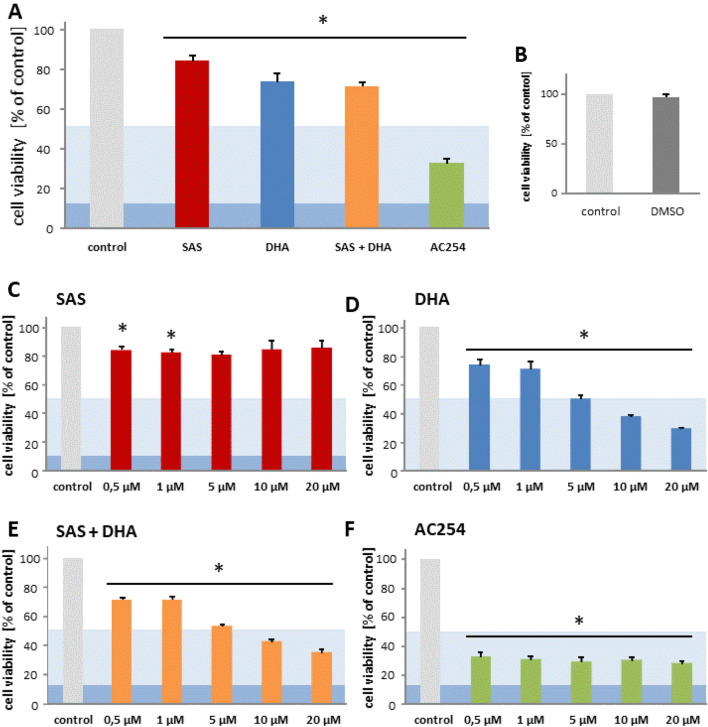
Figure 3.
Cytotoxic profiling of Sulfasalazine, DHA and the novel sulfasalazine-dihydroartemisinin hybrid AC254 on rodent glioma cells. (A) Cells were treated with 0.5 µM of SAS, DHA, AC254 and the combination of SAS and DHA. Cell viability was measured after 72 h. n ≥ 4. * indicates significance to control (p < 0.05). The light blue marking indicates the value of IC50 and the dark blue one stands for IC 90 value. This is passable for the following figures. (B) Cells were treated with 0.05% DMSO which represents the maximum concentration of DMSO achieved at the treatment with 20 µM at the combinational treatment of SAS and DHA. At all other treatments the concentration of DMSO was less. Measurements were made after 72 h. (C–F) Cells were treated the same way as in A with different concentrations of the compounds, SAS (C), DHA (D), SAS combined with DHA (E) and the hybrid AC254 (F). n ≥ 4. * indicates significance to control (p < 0.05).

