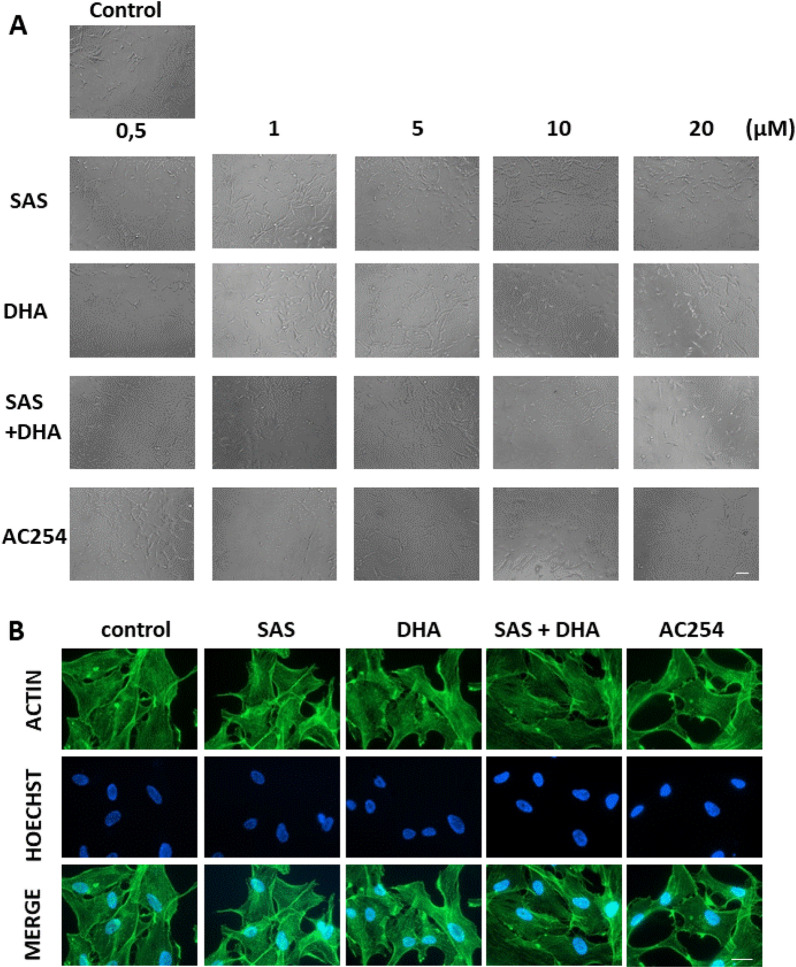
Figure 8.
Impact on human cell morphology. (A) Human cells (U87) were treated with a variation of concentrations of SAS, DHA, their covalently bound hybrid (AC254) and their 1:1 mixture. Cell morphology was examined after 72 h with light microscopy. Olympus × 71 with cell F-Software (Olympus). Scale bar, 200 µM. (B) Cells (U87) were treated with 5 µM of SAS, DHA, AC254 and SAS combined with. Cells were fixated and stained with actin marker Phalloidin 488 and DNA marker Hoechst after 24 h of treatment. Axio Observer with Zen Software (Zeiss). Scale bars represents 20 µm.

