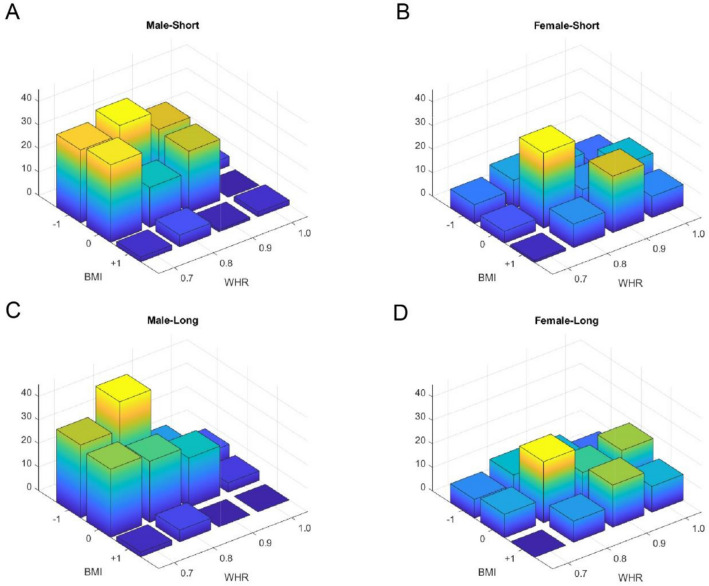
Figure 1.
Histogram of the most attractive selected stimuli. X and y axes show BMI and WHR respectively, and the z-axis shows the number of participants that have selected the corresponding bin of the histogram. (A) Male-Short: male participant selecting for a short-term relationship; (C) Male-Long: male participant selecting for a long-term relationship; (B) Female-Short: female participant selecting for a short-term relationship; (D) Female-Long: female participant selecting for a long-term relationship.

