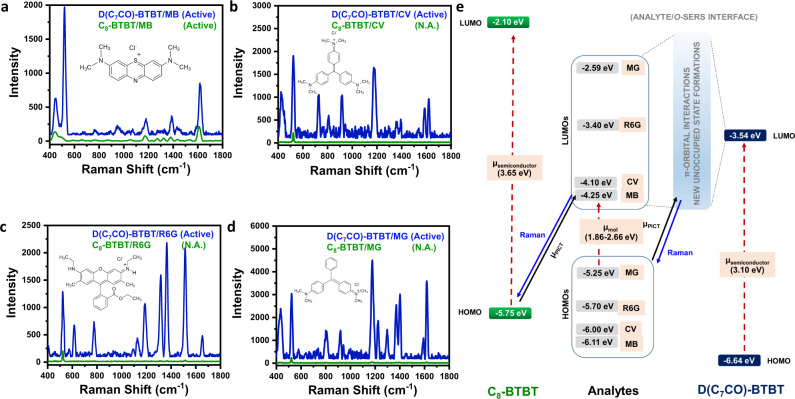
Fig. 6. Raman enhancement for D(C7CO)-BTBT and C8-BTBT films, and chemical enhancement mechanism.
SERS spectra of methylene blue (MB) (a), crystal violet (CV) (b), rhodamine 6 G (R6G) (c), and malachite green (MG) (d) analytes on D(C7CO)-BTBT and C8-BTBT films. Insets depict the molecular structures of the analyte molecules. e Energy level diagram for the current analyte/o-SERS systems for D(C7CO)-BTBT and C8-BTBT showing the frontier molecular orbital (HOMO/LUMO) energies and plausible (shown with solid black arrow)/non-plausible (shown with dashed red arrows) transitions. µPICT stands for photoinduced charge-transfer between analyte and semiconductor under the excitation of 785 nm. Raman signals were produced during the transitions shown with blue solid arrows.

