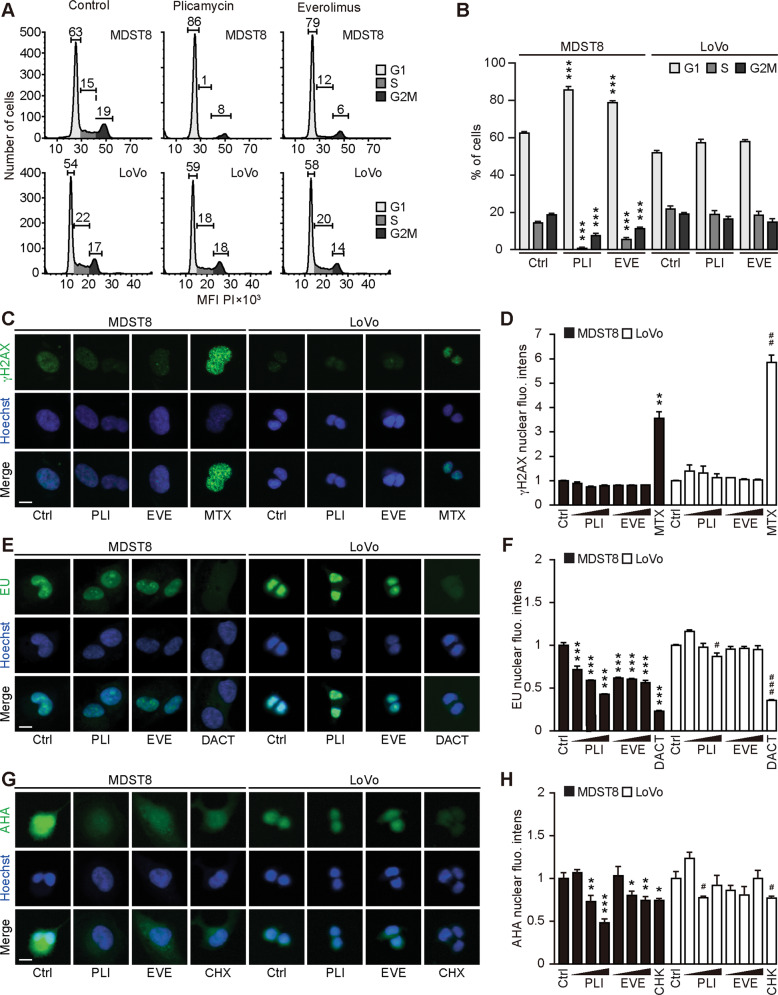
Fig. 4. Cellular stress response to everolimus and plicamycin.
A, B Alterations in the cell cycle progression in response to plicamycin (PLI) or everolimus (EVE) were studied by flow cytometry. Human colon cancer MDST8 and LoVo cells were treated with 50 nM PLI or 100 nM EVE for 48 h, then fixed and stained with FxCycle™ PI/RNase, followed by flow cytometric assessment. Representative cell cycle histograms of MDST8 and LoVo cells are shown in (A) and the percentage of cells in each cell cycle phase are depicted as a bar chart in (B). Error bars indicate SEM. Asterisks refer to significant effects for treatments versus control (paired Student’s t test, *P < 0.05, **P < 0.01, ***P < 0.001). C–H MDST8 and LoVo cells were pre‐treated with EVE at 0.01, 0.1, and 1 μM, or with PLI at 12.5, 25, and 50 nM for 24 h; with mitoxantrone (MTX) at 1 μM for 16 h; with dactinomycin (DACT) at 2 μM, or cycloheximide (CHX) at 50 μM for 6 h followed by fixation and permeabilization. Then, cells were incubated with a rabbit anti‐phospho-histone H2A.X (γH2A.X) antibody and stained with an anti‐rabbit Alexa Fluor‐488‐coupled secondary antibody. The formation of nuclear γH2A.X+ foci is shown in (C) and the average nuclear intensity of the γH2A.X signal was quantified (D). Cells were pre‐treated with the aforementioned compounds in a complete medium and followed by an additional hour of treatment in the presence of 100 mM 5‐ethynyl uridine (EU). After fixation, cells were permeabilized, and EU was stained with an Alexa Fluor‐488‐coupled azide. Representative images are shown for each treatment (E). The EU intensity in the nucleus of each condition was ranked between the untreated control (control, Ctrl, 0% transcription inhibition) and the control that was not incubated with EU (corresponding to 100% transcription inhibition) (F). Cells were pre‐treated with the aforementioned compounds in complete medium followed by washout and treatment pursued in the methionine‐free medium for 30 min. Afterward, the treatments were continued in methionine‐free medium supplemented with 50 μM L‐azidohomoalanine (AHA) for 1 h and AHA incorporation was detected after fixation, permeabilization, and blocking by the addition of an Alexa Fluor‐488‐coupled azide. Then, images were acquired (G), and AHA intensity in the cells was ranked between the untreated control (Ctrl, 0% translation inhibition) and control without AHA (corresponding to 100% translation inhibition) (H). Data information: representative images of EVE 1 μM, PLI 50 nM and MTX 1 μM are shown (C); EVE 0.1 μM, PLI 25 nM, and DACT 2 μM are shown (E); EVE 1 μM, PLI 50 nM, and CHX 50 μM are shown (G). Scale bars represent 20 μm. One representative experiment among three is shown as mean ± SD, and P‐values indicating differences to controls were calculated with Student’s t test: *P < 0.05, **P < 0.01, ***P < 0.001 versus untreated MDST8 control; #P < 0.05, ##P < 0.01, ###P < 0.001 versus untreated LoVo control (D, F, H).

