Abstract
Breast cancer is the most common cancer and the leading cause of cancer-related deaths in women. Increasing molecular targets have been discovered for breast cancer prognosis and therapy. However, there is still an urgent need to identify new biomarkers. Therefore, we evaluated biomarkers that may aid the diagnosis and treatment of breast cancer. We searched three mRNA microarray datasets (GSE134359, GSE31448 and GSE42568) and identified differentially expressed genes (DEGs) by comparing tumor and non-tumor tissues using GEO2R. Functional and pathway enrichment analyses of the DEGs were performed using the DAVID database. The protein–protein interaction (PPI) network was plotted with STRING and visualized using Cytoscape. Module analysis of the PPI network was done using MCODE. The associations between the identified genes and overall survival (OS) were analyzed using an online Kaplan–Meier tool. The redundancy analysis was conducted by DepMap. Finally, we verified the screened HUB gene at the protein level. A total of 268 DEGs were identified, which were mostly enriched in cell division, cell proliferation, and signal transduction. The PPI network comprised 236 nodes and 2132 edges. Two significant modules were identified in the PPI network. Elevated expression of the genes Discs large-associated protein 5 (DLGAP5), aurora kinase A (AURKA), ubiquitin-conjugating enzyme E2 C (UBE2C), ribonucleotide reductase regulatory subunit M2(RRM2), kinesin family member 23(KIF23), kinesin family member 11(KIF11), non-structural maintenance of chromosome condensin 1 complex subunit G (NCAPG), ZW10 interactor (ZWINT), and denticleless E3 ubiquitin protein ligase homolog(DTL) are associated with poor OS of breast cancer patients. The enriched functions and pathways included cell cycle, oocyte meiosis and the p53 signaling pathway. The DEGs in breast cancer have the potential to become useful targets for the diagnosis and treatment of breast cancer.
Subject terms: Breast cancer, Cancer screening
Introduction
Breast cancer has now overtaken lung cancer as the leading cause of cancer incidence worldwide, with an estimated 2.3 million new cases, accounting for 11.7% of all cancer cases1. In China, more than 300,000 women are diagnosed with breast cancer each year. About 70–80% of breast cancer patients with early stage non-metastatic disease can be cured, while advanced breast cancers with distant organ metastases are considered untreatable with currently available therapies2.
The global death rate from breast cancer is declining because of new therapeutic strategies, especially the targeted therapy. Increasing molecular targets have been discovered for breast cancer prognosis and therapy. In 2000, Perou and Sorlie reported that breast cancer could be divided into three subtypes according to the enrichment of three genes, luminal (estrogen receptor [ER]-positive), human epidermal growth factor receptor 2 (HER2, encoded by ERBB2)-positive and ER-negative, and basal subtypes3. Since then, several genes have been identified as predictive and prognostic biomarkers for breast cancer, which play important roles in targeted therapy. The most commonly used molecular-targeted drugs for HER2-positive breast cancer include tucatinib4, trastuzumab5, pertuzumab, lapatinib, neratinib and trastuzumab emtansine (T-DM1)6,7. Several drugs target the phosphoinositide 3-kinase (PI3K)/serine/threonine kinase(AKT) /mammalian target of rapamycin (mTOR) signaling pathway, including GDC-0068, Bez235, bupacoxib, abencoxib and alpelisib8–10. Vascular endothelial growth factor (VEGF) has also been identified as a key target for anti-angiogenic therapy, and its inhibitors bevacizumab, sorafenib, and sunitinib are also used for breast cancer therapy11,12. Androgen receptor (AR)-targeted therapies, including AR agonists and AR antagonists, have shown promising results in clinical trials for breast cancer patients, and combinations of AR-targeted therapies with other reagents (eg. PI3K inhibitor) have been studied to overcome resistance to AR-targeted therapies13. In addition, targeted therapies have been developed for epidermal growth factor receptor (EGFR), BRCA1/2-mutated polyadenosine diphosphate ribose polymerase (PARP), cyclin-dependent kinase 4/6 (CDK4/6), BTB and CNC homology1 (BACH1), and so on14–18. However, because of tumor heterogeneity, low ratios of responders, relapse and drug resistance, there is still an urgent need to identify new biomarkers that may aid the diagnosis and treatment of breast cancer.
Bioinformatics analysis is a valuable strategy for the comprehensive analysis of large databases, including complicated genetic information. In our study, we used sophisticated bioinformatics methods to screen potential biomarkers that may be useful for breast cancer. The Gene Expression Omnibus (GEO) [https://www.ncbi.nlm.nih.gov/geo/] database is an open database that allows researchers to select appropriate mRNA expression profiles. Online analysis tools are available to detect DEGs between tumors and normal tissues. In our study, we obtained three mRNA microarray datasets from the GEO (GSE134359, GSE31448, and GSE42568) and searched for DEGs using GEO2R. We then performed functional and pathway enrichment analyses of the identified DEGs using the DAVID database. PPI networks were constructed using STRING and visualized using Cytoscape. Conduct module analyses of the PPI network were performed using MCODE. The associations of these genes with OS were determined using an online Kaplan–Meier analysis tool. Finally, several breast cancer-related molecules were selected to investigate their potential role in a breast cancer diagnostic system.
Methods
Subjects and gene information
The GEO database is a national repository of genetic information databases, including microarray and next-generation sequencing data19. GEO2R is an online tool that can be used to detect DEGs from two or more GEO datasets. In this study, we retrieved three gene expression profiles (GSE134359, GSE31448 and GSE42568) from the GEO database. GSE134359 (Platform GPL17586) comprised 74 breast cancer samples and 12 noncancerous samples, GSE31448 (Platform GPL570) comprised 29 breast cancer samples and 4 noncancerous samples, and GSE42568 (Platform GPL570) comprised 104 breast cancer samples and 17 noncancerous samples. The characteristics of these datasets are shown in Table 1. More detailed patient information is provided in supplementary material 1. The “Reporting recommendations for tumor marker prognostic studies (REMARK)” were followed20.
Table 1.
Summary of patient characteristics of three GEO datasets.
Data analysis
We used GEO2R with screening criteria of adj. P < 0.05, log2 FC (fold change) > 1.5, or log2 FC < − 1.5 to detect DEGs in breast cancer tissues compared with normal samples. We also used an online tool (http://bioinformatics.psb.ugent.be/webtools/Venn/) to plot Venn diagrams of the DEGs of three datasets.
Gene ontology (GO) and Kyoto encyclopedia of genes and genomes (KEGG) pathway analysis
DAVID (http://david.ncifcrf.gov; version 6.8) is an open database that integrates biological data and analytical tools for functional annotation of genes and pathways21. GO is a bioinformatics tool for annotating genes and analyzing the biological processes they are involved in. KEGG is a database for analyzing relevant signaling pathways in largescale molecular datasets generated by high-throughput experimental techniques22. DAVID was used for GO enrichment analysis of the DEGs in terms of the molecular function, cell composition and biological process for each gene. KEGG pathway enrichment analysis was performed to clarify the function of the DEGs and the cell signaling pathways.
PPI network visualization
We used the online analysis tool STRING (http://www.string-db.org/), with a confidence of 0.4, to construct the PPI network diagram for the identified DEGs. Cytoscape software23 was then used to construct the interaction network map, and the MCODE plug-in was used to screen the key gene modules in the network map. Cytoscape (version 3.8.0) is an open-source bioinformatics tool used to generate visual molecular interaction networks and the plug-in Molecular Complex Detection (MCODE) can develop key gene modules in the network. For this, we set the following parameters in MCODE: Degree Cut-off = 2, Node Score Cut-off = 0.2, K-Core = 2 and Max Depth = 10024.
Kaplan–Meier survival and redundancy analyses of DEGs
A Kaplan–Meier plotter has been developed to evaluate the effects of 54,000 transcripts (mRNA, miRNA, protein) on survival for 21 types of cancer, including breast cancer (n = 6234), ovarian cancer (n = 2190), lung cancer (n = 3452), and stomach cancer (n = 1440)25. This database collates data from the GEO, European Genome-phenome Archive, and The Cancer Genome Atlas (TCGA) databases. The website was used to plot the OS for breast cancer patients for each gene. By selecting the best cutoff, a survival analysis was performed and False-Discovery Rate (FDR) was computed using the Benjamini–Hochberg method to correct for multiple hypothesis testing26. The hazard ratio (HR) and log-rank P values with 95% confidence intervals (CI) were calculated and displayed on the graph.
Cancer Dependency Map (Cancer DepMap, https://depmap.org/portal/), a RNAi and CRISPR-Cas9 knockout database27,28, was used to identified the functional target genes those are essential for breast cancer survival. The essential genes are potential therapeutic targets for breast cancer.
Protein level verification
We visualized the selected hub-gene through ualcan29, and the protein expression data with 18 normal and 125 breast cancer samples were from CPTAC (Office of Cancer Clinical Proteomics Research, https://proteomics.cancer.gov/programs/cptac).
Results
Screening of DEGs
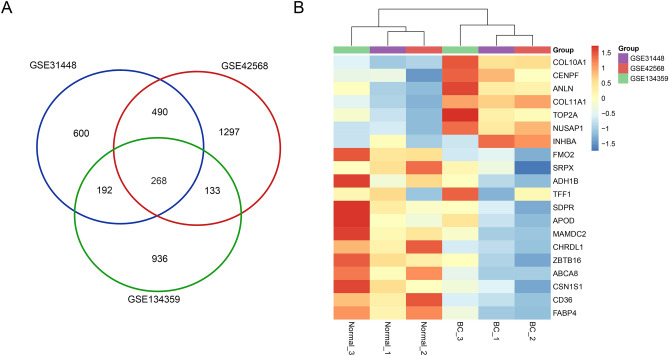
A total of 1529, 1550, and 2188 DEGs were identified from the GSE134359, GSE31448, and GSE42568 datasets, respectively. Of these, 268 genes were present in all three datasets (Fig. 1A). 89 genes consistently showed high expression and 179 genes showed low expression in all three databases. The top 22 DEGs are shown on the heatmap, based on the criteria |log2 FC|> 3 and adj.P < 0.05 (Fig. 1B).
Figure 1.
Identification of DEGs in the indicated breast cancer datasets. (A) Three online-available expression profiling datasets (GSE134359, GSE31448, GSE42568) were analyzed using GEO2R, and genes differentially expressed in breast tumor and peri-tumor samples (adj. P < 0.05 and |log2 FC |> 1.5) were defined as DEGs, followed by Venn diagram of DEGs. (B) Heatmap of top DEGs (adj.P < 0.05 and |log2 FC|> 3) in datasets GSE134359, GSE31448 and GSE42568.
GO and KEGG pathway enrichment analysis
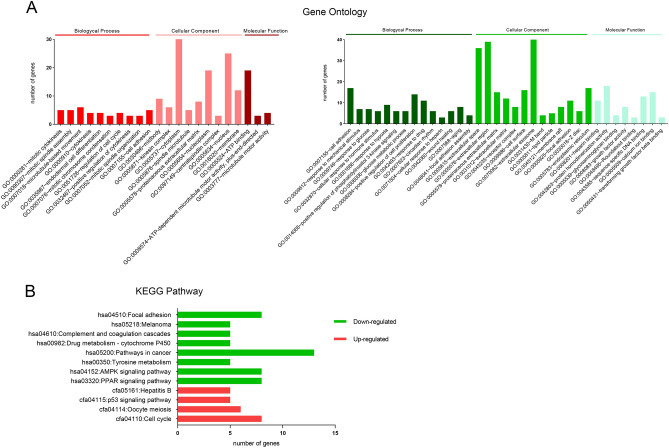
GO enrichment and KEGG pathway analysis were performed on the DEGs using the DAVID database. GO enrichment analysis covers three aspects: biological processes, cell composition and molecular function (Fig. 2A). The upregulated genes were mainly related to mitotic cytokinesis, mitotic spindle assembly and microtubule-based movement; while the downregulated genes were mainly involved in cell adhesion, the response to mechanical stimuli and the response to glucose. The KEGG pathway analysis showed that the genes upregulated in tumors were enriched in cell cycle, oocyte meiosis and the P53 signaling pathway, while the downregulated genes were enriched in PPAR signaling pathway, AMPK signaling pathway, tyrosine metabolism, pathways in cancer and so on (Fig. 2B).
Figure 2.
GO and KEGG analyses of DEGs. (A) GO analysis with up-regulated (red) and down-regulated (green) DEGs. Enriched GO items with P < 0.01 are shown, including biological process, cellular component, and molecular function. (B) KEGG analysis with up-regulated (red) and down-regulated (green) DEGs. Enriched KEGG pathways (P < 0.01) are shown.
PPI network construction and module selection
Considering the critical role of protein interactions in protein function, we used the STRING database and Cytoscape software to generate PPI network once we had identified the 268 DEGs. The results showed that there were dense regions in PPI, that is, genes closely related to breast cancer (HUB genes) modules.
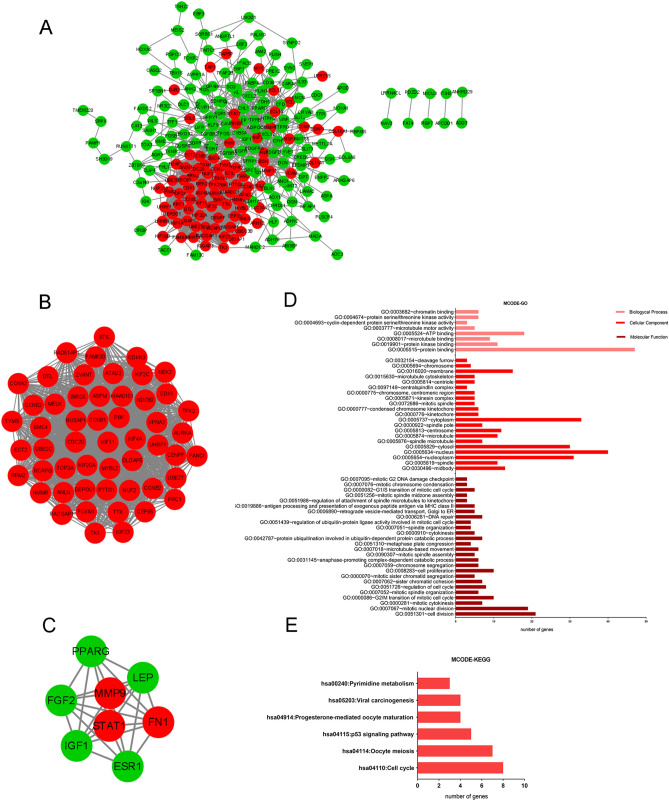
A total of 236 nodes and 2132 edges were selected to plot the PPI network, which consisted of 87 up-regulated genes and 149 down-regulated genes (Fig. 3A). Subsequently, a pivotal module of 53 genes (CDK1, KIF11, DLGAP5, KIF4A and so on) was identified with the degree ≥ 10 as the cut-off value by using MCODE (Fig. 3B). Another important module of 8 genes including both up-regulated and down-regulated genes was also identified (Fig. 3C). The top 10 HUB genes were identified by cytoHubba (Top 10 genes ranked in MCC). GO and KEGG analysis of these ten genes were conducted. HUB genes are related with cell division, mitotic cytokinesis in Biologycal Process; spindle, nucleus, spindle microtubule in Cellular Component; protein kinase binding, ATP binding in Molecular Function (Fig. 3D). They are also enriched in cell cycle, oocyte meiosis, p53 signaling pathway and so on (Fig. 3E).
Figure 3.
PPI and MCODE analyses of DEGs. (A) Protein–protein interaction network of 268 DEGs. (B) A significant module, containing 53 up-regulated proteins, was selected from protein–protein interaction network. (C) Another module selected from protein–protein interaction network. (D) GO analysis of MCODE genes. Enriched GO items with P < 0.01 are shown. (E) KEGG pathway analysis of MCODE genes. Enriched pathways with P < 0.05 are shown. For (A–C), red nodes are up-regulated proteins, and green nodes are down-regulated proteins. The lines represent the interaction relationship between nodes.
Survival and redundancy analyses
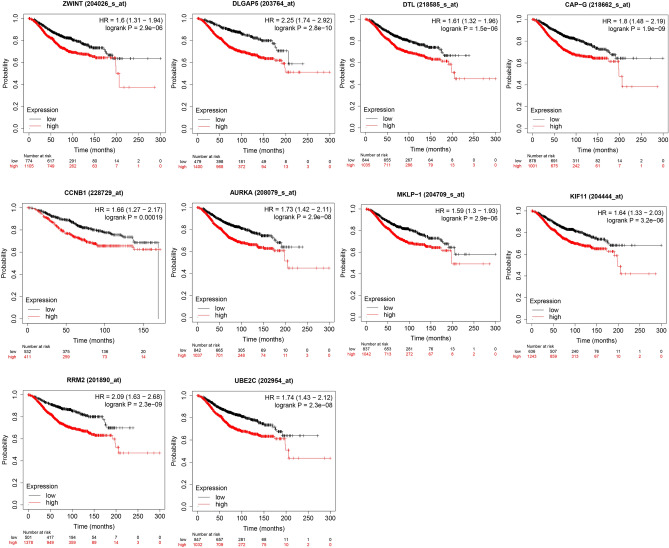
Ten HUB genes in PPI network were evaluated for their prognostic value on the Kaplan–Meier plotter. All 10 genes exhibited their potential in the prediction of survival based on their expression. The OS for breast cancer patients was determined based on the expression level of each gene (low vs. high). As shown in Fig. 4, high mRNA expression of ZWINT (HR 1.6, 95% CI: 1.31–1.94, P < 2.9E−6, FDR 1%) was associated with a poorer OS for breast cancer patients, and this association also works for DLGAP5 (HR 2.25, 95% CI: 1.74–2.92, P = 2.8e−10, FDR 1%), DTL (HR 1.61, 95% CI: 1.32–1.96, P < 1.5E−6, FDR 1%), NCAPG(HR 1.6, 95% CI: 1.48–2.19, P < 1.9E−9, FDR 1%), CCNB1 (HR 1.66, 95% CI: 1.27–2.17, P < 0.00019, FDR 10%), AURKA (HR 1.73, 95% CI: 1.42–2.11, P < 2.9E−8, FDR 1%), KIF23 (HR 1.59, 95% CI: 1.3–1.93, P < 2.9E−6, FDR 1%), KIF11 (HR 1.64, 95% CI: 1.33–2.03, P < 3.2E−6, FDR 1%), RRM2 (HR 2.09, 95% CI: 1.63–2.68, P < 2.3E−9, FDR 1%) and UBE2C (HR 1.74, 95% CI: 1.43–2.12, P < 2.3E−8, FDR 1%). Among them, FDR of CCNB1 was 10%. Maybe the relationship between CCNB1 and survival is not obvious.
Figure 4.
Prognostic estimation of the top 10 HUB genes. The top 10 HUB genes including ZWINT, DLGAP5, DTL, NCAPG, CCNB1, AURKA, KIF23, KIF11, RRM2 and UBE2C, were identified by cytoHubba, followed by survival analysis. Breast cancer patients were divided into two groups according to auto select best cutoff. Low, patients with gene expression lower than best cutoff; high, patients with gene expression higher than best cutoff.
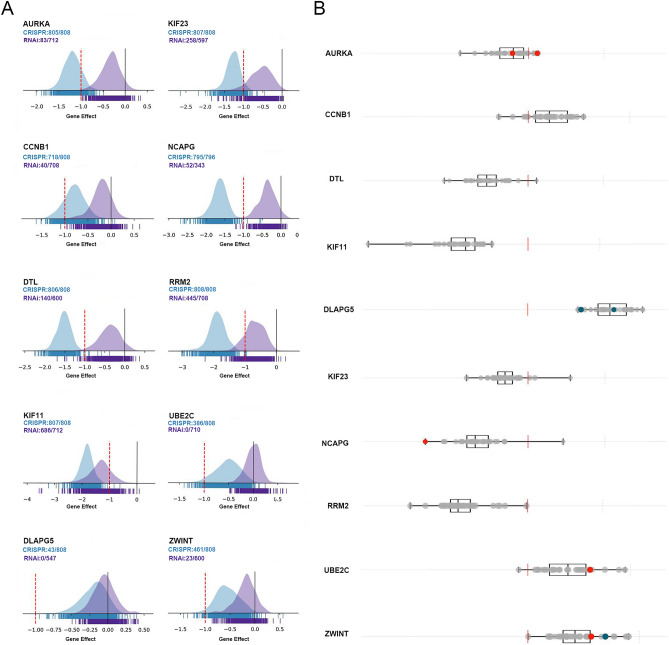
It is of great significance to analyze the role of HUB genes in breast cancer cell survival, and the essential genes are potential therapeutic targets. Here we analyzed the function of HUB genes using online-available DepMap tool, which was established based on CRISPR screening and siRNA screening data. There are 2 genes (KIF11, RRM2) that are common essential in both CRIAPR knockout and RNAi; 6 genes (AURKA, CCNB1, DTL, KIF23, NCAPG, ZWINT) that are common essential only in CRISPR knockout, indicating that these genes are not only diagnosis markers but also potential therapeutic targets (Fig. 5).
Figure 5.
Redundancy analysis of the top 10 HUB genes. The essential role of indicated HUB genes in breast cancer cell survival was analyzed via DepMap, (https://depmap.org/portal/), which was established from CRISPR and RNAi screening data. (A) Redundancy analysis of ten genes in total cells lines. (B) The CERES dependency score of ten genes in breast cancer cells. A lower CERES score indicates a higher likelihood that the gene of interest is essential in a given cell line. A score of 0 indicates a gene is not essential (dotted line); − 1 is comparable to the median of all pan-essential genes (red line).
Protein level verification
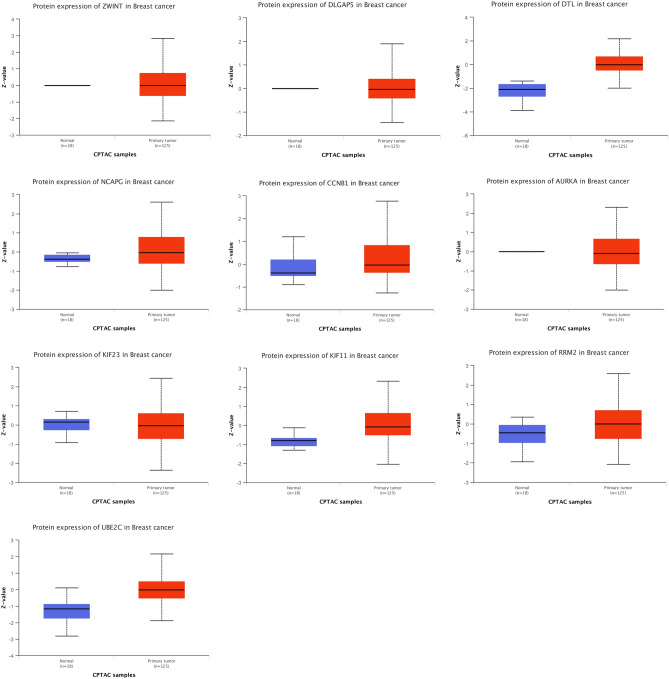
Finally, we verified the screened HUB genes at the protein level (Fig. 6). The statistical significance of ZWINT (< 1E-12), DLGAP5 (< 1E−12), DTL (1.335246E-04), NCAPG (2.391440E−04), CCNB1 (3.434030E−03), AURKA (< 1E−12), KIF11 (5.4090702551948E−13), RRM2 (4.27904E−03) and UBE2C (1.99866742542919E−06) was less than 0.05, except KIF23 (9.61308686E−01).
Figure 6.
Protein expression of the top 10 HUB genes. The top 10 HUB genes, including ZWINT, DLGAP5, DTL, NCAPG, CCNB1, AURKA, KIF23, KIF11, RRM2 and UBE2C, were identified by cytoHubba, verified at the protein level by Ualcan. Z-values represent standard deviations from the median across samples for the given cancer type. Log2 Spectral count ratio values from CPTAC were first normalized within each sample profile, then normalized across samples.
Discussion
Regardless of recent progress in the treatment of breast cancer, it has remained the most common cause of cancer-related deaths in the past few years. The high mortality rate of breast cancer is partly due to the lack of adequate screening methods with high sensitivity and specificity. Therefore, it is necessary to identify potential biomarkers for screening and early diagnosis of breast cancer. Microarray technologies and next-generation sequencing have become key tools for providing comprehensive genetic information on breast cancer samples and revealing the changes in disease progression. In this study, we used proven online bioinformatics tools to investigate possible biomarkers for diagnosis of breast cancer. We identified a total of 268 DEGs common to all three GEO datasets, which included 89 upregulated genes and 179 downregulated genes.
The upregulated genes were mainly involved in the three pathways, namely cell cycle, oocyte meiosis and the P53 signaling pathway, which are closely associated with cancer. The downregulated genes were mainly enriched in three other pathways: cell adhesion, the response to mechanical stimuli and the response to hormonal hypoxia. Among the identified DEGs, 87 showed high degrees in the PPI network. Further analysis revealed that the following 10 DEGs within these modules were closely associated with a shorter survival time of breast cancer patients: DLGAP5, AURKA, UBE2C, CCNB1, RRM2, KIF23, KIF11, NCAPG, ZWINT and DTL.
DLGAP5 is involved in Aurora A signaling and its neurogenic locus notch homolog protein 3 (NOTCH3) intracellular domain regulates transcription. DLGAP5 overexpression is associated with poor prognosis of breast cancer30. DLGAP5 is also associated with the prognosis of colorectal cancer, prostate cancer, and non-small cell lung cancer (NSCLC)31–35. A study identified a critical target of NOTCH3 signaling was the mitotic apparatus organizing protein DLGAP5 (HURP/DLG7)36. DLGAP5, which is regulated by nucleolar and spindle associated protein 1 (NUSAP1), is associated with the proliferation, migration and invasion of invasive breast cancer37. DLGAP5, required for AURKA-dependent, centrosome-independent mitotic spindle assembly, is essential for the survival and proliferation of SMARCA4/BRG1 mutant38. One subpopulation of prostate cancerwas associated with enhanced expression of DLGAP5 and decreased dependence upon androgen receptor signaling39.
AURKA plays an important role in cell cycle progression by promoting cell entry into mitosis, and is associated with increased risk of developing breast cancer. AURKA can translocate to the nucleus and enhance the phenotype of breast cancer stem cells, promoting unique oncogenic properties in malignant cells40. It has been reported that AURKA regulates the phenotype of breast cancer tumor stem cells by modifying and stabilizing Drosha mRNA with M6A41. In addition, AURKA plays an important role in the treatment of drug-resistant breast cancer42, and Aurora kinase A inhibitor has been in a five-arm phase 2 study for safety and activity43.
UBE2C can ubiquitinate Anaphase-Promoting Complex/Cyclosome (APC/C) (Ub)44. The high expression of UBE2C in breast cancer was reported to be an independent prognostic factor associated with increased risk of disease recurrence and death. Thus, it is considered as a potential therapeutic target for breast cancer45–47.
Cyclin B1, the protein encoded by CCNB1, is a regulatory protein involved in mitosis. It is necessary for proper control of the G2/M transition phase of the cell cycle. A study showed cyclin B1 and B2 transgenic mice are highly prone to tumors, including tumor types where B-type cyclins serve as prognosticators48. CCNB1 is associated with radiosensitivity in colorectal cancer49. CCNB1 can also affect cavernous sinus invasion in pituitary adenomas through the epithelial-mesenchymal transition50.
The gene RRM2 encodes ribonucleotide reductase regulatory subunit M2, one of two non-identical subunits of ribonucleotide reductase. In a study that reported RRM2 acetylation at K95 suppresses tumor cell growth in vitro and in vivo, and is therefore a potentially attractive strategy for cancer therapy51. In a study that searched the GEO database for miRNA-mRNA or lncRNA-mRNA as novel biomarkers for breast cancer, the miR-21/RRM2 axis was identified as a candidate biomarker for the diagnosis and treatment of breast cancer52. In another study that showed a lincRNA, lincNMR, regulates tumor cell proliferation through a YBX1-RRM2-TYMS-TK1 axis governing nucleotide metabolism53. In addition, RRM2 was reported to be associated with the prognosis of prostate cancer54.
Kinesin family member 23, the protein encoded by KIF23 is a member of the kinesin-like protein family, also known as MKLP1. MKLP1/KIF23 is the kinesin component of the centralspindlin complex55. It was reported that KIF23 expression is high in the majority of primary and metastatic lung cancer tissues or cell lines, and it is associated with poor survival56. In a study that examined the association between members of the kinesin family and breast cancer, KIF23 and KIF11 were found to be associated with poor prognosis57. KIF23 is regulated through wnt signaling pathway and associated with recurrence of hepatocellular carcinoma58.
Kinesin family member 11, the protein encoded by KIF11, is another member of the kinesin-like protein family. According to an Oncomine analysis of GEO and TCGA databases, KIF11 is a proto-oncogene associated with breast cancer and is significantly associated with poor prognosis59. KIF11 is also regulated through wnt signaling pathway and associated with recurrence of hepatocellular carcinoma.
NCAPG is a potential prognostic marker in HER2+ breast cancer, and a therapeutic target to effectively overcome trastuzumab resistance as well60. NCAPG has also been identified as a key gene in triple-negative breast cancer61 as well as hepatocellular carcinoma62. Furthermore, it was reported that high expression of NCAPG is associated with poor prognosis of various tumor types, and its overexpression may play an important role in the regulation of tumor-related pathways in tumor growth63.
Currently, little is known about the role of ZW10 interactor (ZWINT) in breast cancer. Denticleless E3 ubiquitin protein ligase homolog (DTL) is associated with proliferation and appears to be a promising molecular therapeutic target in breast cancer64. DTL may also be associated with poor prognosis of acral melanoma and gastric carcinoma65,66.
Based on redundancy analysis, two genes, KIF11 and RRM2, may serve as therapeutic targets or prognostic indicators. The two genes are also differentially expressed by protein level verification. There are many differences between the predicted data and the clinical data, and the survival data derived from the Kaplan–Meier tool need to be validated. In future studies, more attention should be paid to breast cancer patients. There are many tumor subtypes for breast cancer, and it is necessary to define the biomarker characteristics of each subtypes. In our future study, we intend to recruit a cohort of breast cancer patients to investigate the sensitivity and specificity of these biomarkers for early screening of breast cancer; the results should facilitate the clinical application of these biomarkers for the diagnosis of breast cancer.
Supplementary Information
Acknowledgements
The authors thank all individuals who contributed sample information and research personnel who have been responsible for data acquisition. Data are available from GEO database. This work was supported by Ministry of Science and Technology of the People's Republic of China (2020YFA0803500), National Natural Science Foundation of China (31922024). We thank the supporting grants from Zhengzhou University to Pingping Zhu, and the technical support from Modern Analysis and Computer Center of Zhengzhou University.
Author contributions
X.Z. wrote the main manuscript text and prepared Figs. 1, 2, 3, 4, and 5. G.S. prepared Fig. 1. All authors reviewed the manuscript.
Funding
This work was supported by Ministry of Science and Technology of the People's Republic of China (2020YFA0803500), National Natural Science Foundation of China (31922024).
Data availability
The datasets are available from the GEO database.
Competing interests
The authors declare no competing interests.
Footnotes
Publisher's note
Springer Nature remains neutral with regard to jurisdictional claims in published maps and institutional affiliations.
Contributor Information
Qiankun He, Email: qiankunhe@zzu.edu.cn.
Pingping Zhu, Email: zhup@zzu.edu.cn.
Supplementary Information
The online version contains supplementary material available at 10.1038/s41598-021-00268-9.
References
- 1.Sung HG, et al. Global caner statistics 2020: GLOBOCAN estimates of incidence and mortality worldwide for 36 cancers in 185 countries. CA Cancer J. Clin. 2020 doi: 10.3322/caac.21660. [DOI] [PubMed] [Google Scholar]
- 2.Harbeck N, et al. Breast cancer. Nat Rev Dis Primers. 2019;5:1–66. doi: 10.1038/s41572-019-0111-2. [DOI] [PubMed] [Google Scholar]
- 3.Perou CM, et al. Molecular portraits of human breast tumours. Nature. 2000;406:747–752. doi: 10.1038/35021093. [DOI] [PubMed] [Google Scholar]
- 4.Murthy RK, et al. Tucatinib, trastuzumab, and capecitabine for HER2-positive metastatic breast cancer. N. Engl. J. Med. 2020;382:597–609. doi: 10.1056/NEJMoa1914609. [DOI] [PubMed] [Google Scholar]
- 5.von Minckwitz G, et al. Trastuzumab emtansine for residual invasive HER2-positive breast cancer. N. Engl. J. Med. 2019;380:617–628. doi: 10.1056/NEJMoa1814017. [DOI] [PubMed] [Google Scholar]
- 6.Oh DY, Bang YJ. HER2-targeted therapies - a role beyond breast cancer. Nat. Rev. Clin. Oncol. 2020;17:33–48. doi: 10.1038/s41571-019-0268-3. [DOI] [PubMed] [Google Scholar]
- 7.Swain SM, et al. Pertuzumab, trastuzumab, and docetaxel for HER2-positive metastatic breast cancer (CLEOPATRA): end-of-study results from a double-blind, randomised, placebo-controlled, phase 3 study. Lancet Oncol. 2020;21:519–530. doi: 10.1016/S1470-2045(19)30863-0. [DOI] [PubMed] [Google Scholar]
- 8.Ippen FM, et al. Targeting the PI3K/Akt/mTOR pathway with the pan-Akt inhibitor GDC-0068 in PIK3CA-mutant breast cancer brain metastases. Neuro Oncol. 2019;21:1401–1411. doi: 10.1093/neuonc/noz105. [DOI] [PMC free article] [PubMed] [Google Scholar]
- 9.Verret B, Cortes J, Bachelot T, Andre F, Arnedos M. Efficacy of PI3K inhibitors in advanced breast cancer. Ann. Oncol. 2019;30(Suppl 10):x12–x20. doi: 10.1093/annonc/mdz381. [DOI] [PubMed] [Google Scholar]
- 10.Vasan N, et al. Double PIK3CA mutations in cis increase oncogenicity and sensitivity to PI3Kalpha inhibitors. Science. 2019;366:714–723. doi: 10.1126/science.aaw9032. [DOI] [PMC free article] [PubMed] [Google Scholar]
- 11.Baselga J, et al. Sorafenib in combination with capecitabine: an oral regimen for patients with HER2-negative locally advanced or metastatic breast cancer. J. Clin. Oncol. 2012;30:1484–1491. doi: 10.1200/JCO.2011.36.7771. [DOI] [PubMed] [Google Scholar]
- 12.Uribesalgo I, et al. Apelin inhibition prevents resistance and metastasis associated with anti-angiogenic therapy. EMBO Mol. Med. 2019;11:e9266. doi: 10.15252/emmm.201809266. [DOI] [PMC free article] [PubMed] [Google Scholar]
- 13.Kono M, et al. Androgen receptor function and androgen receptor-targeted therapies in breast cancer: a review. JAMA Oncol. 2017;3:1266–1273. doi: 10.1001/jamaoncol.2016.4975. [DOI] [PubMed] [Google Scholar]
- 14.Esteva FJ, Hubbard-Lucey VM, Tang J, Pusztai L. Immunotherapy and targeted therapy combinations in metastatic breast cancer. Lancet Oncol. 2019;20:e175–e186. doi: 10.1016/S1470-2045(19)30026-9. [DOI] [PubMed] [Google Scholar]
- 15.Baselga J, et al. Randomized phase II study of the anti-epidermal growth factor receptor monoclonal antibody cetuximab with cisplatin versus cisplatin alone in patients with metastatic triple-negative breast cancer. J. Clin. Oncol. 2013;31:2586–2592. doi: 10.1200/JCO.2012.46.2408. [DOI] [PMC free article] [PubMed] [Google Scholar]
- 16.O'Shaughnessy J, et al. Iniparib plus chemotherapy in metastatic triple-negative breast cancer. N. Engl. J. Med. 2011;364:205–214. doi: 10.1056/NEJMoa1011418. [DOI] [PubMed] [Google Scholar]
- 17.Salazar LG, et al. Topical imiquimod plus nab-paclitaxel for breast cancer cutaneous metastases: a phase 2 clinical trial. JAMA Oncol. 2017;3:969–973. doi: 10.1001/jamaoncol.2016.6007. [DOI] [PMC free article] [PubMed] [Google Scholar]
- 18.Lee J, et al. Effective breast cancer combination therapy targeting BACH1 and mitochondrial metabolism. Nature. 2019;568:254–258. doi: 10.1038/s41586-019-1005-x. [DOI] [PMC free article] [PubMed] [Google Scholar]
- 19.Barrett T, et al. NCBI GEO: archive for functional genomics data sets–update. Nucleic Acids Res. 2013;41:D991–995. doi: 10.1093/nar/gks1193. [DOI] [PMC free article] [PubMed] [Google Scholar]
- 20.McShane LM, et al. REporting recommendations for tumor MARKer prognostic studies (REMARK) Breast Cancer Res. Treat. 2006;100:229–235. doi: 10.1007/s10549-006-9242-8. [DOI] [PubMed] [Google Scholar]
- 21.Huang DW, et al. DAVID Bioinformatics resources: expanded annotation database and novel algorithms to better extract biology from large gene lists. Nucleic Acids Res. 2007;35:W169–175. doi: 10.1093/nar/gkm415. [DOI] [PMC free article] [PubMed] [Google Scholar]
- 22.Kanehisa M, Furumichi M, Tanabe M, Sato Y, Morishima K. KEGG: new perspectives on genomes, pathways, diseases and drugs. Nucleic Acids Res. 2017;45:D353–D361. doi: 10.1093/nar/gkw1092. [DOI] [PMC free article] [PubMed] [Google Scholar]
- 23.Shannon P, et al. Cytoscape: a software environment for integrated models of biomolecular interaction networks. Genome Res. 2003;13:2498–2504. doi: 10.1101/gr.1239303. [DOI] [PMC free article] [PubMed] [Google Scholar]
- 24.Yao Q, et al. Identification of potential genomic alterations and the circRNA-miRNA-mRNA regulatory network in primary and recurrent synovial sarcomas. Front. Mol. Biosci. 2021 doi: 10.3389/fmolb.2021.707151. [DOI] [PMC free article] [PubMed] [Google Scholar]
- 25.Nagy A, Lanczky A, Menyhart O, Gyorffy B. Validation of miRNA prognostic power in hepatocellular carcinoma using expression data of independent datasets. Sci. Rep. 2018;8:9227. doi: 10.1038/s41598-018-27521-y. [DOI] [PMC free article] [PubMed] [Google Scholar]
- 26.Győrffy B. Survival analysis across the entire transcriptome identifies biomarkers with the highest prognostic power in breast cancer. Comput. Struct. Biotechnol. J. 2021;19:4101–4109. doi: 10.1016/j.csbj.2021.07.014. [DOI] [PMC free article] [PubMed] [Google Scholar]
- 27.Dwane L, et al. Project Score database: a resource for investigating cancer cell dependencies and prioritizing therapeutic targets. Nucleic Acids Res. 2021;49:D1365–D1372. doi: 10.1093/nar/gkaa882. [DOI] [PMC free article] [PubMed] [Google Scholar]
- 28.Tsherniak A, et al. Defining a cancer dependency map. Cell. 2017;170:564–576 e516. doi: 10.1016/j.cell.2017.06.010. [DOI] [PMC free article] [PubMed] [Google Scholar]
- 29.Chandrashekar DS, et al. UALCAN: a portal for facilitating tumor subgroup gene expression and survival analyses. Neoplasia. 2017;19:649–658. doi: 10.1016/j.neo.2017.05.002. [DOI] [PMC free article] [PubMed] [Google Scholar]
- 30.Xu T, Dong M, Li H, Zhang R, Li X. Elevated mRNA expression levels of DLGAP5 are associated with poor prognosis in breast cancer. Oncol. Lett. 2020;19:4053–4065. doi: 10.3892/ol.2020.11533. [DOI] [PMC free article] [PubMed] [Google Scholar]
- 31.Branchi V, et al. Prognostic value of DLGAP5 in colorectal cancer. Int. J. Colorectal. Dis. 2019;34:1455–1465. doi: 10.1007/s00384-019-03339-6. [DOI] [PubMed] [Google Scholar]
- 32.Yamamoto S, et al. Identification of new octamer transcription factor 1-target genes upregulated in castration-resistant prostate cancer. Cancer Sci. 2019;110:3476–3485. doi: 10.1111/cas.14183. [DOI] [PMC free article] [PubMed] [Google Scholar]
- 33.Shi YX, et al. Genome-scale analysis identifies NEK2, DLGAP5 and ECT2 as promising diagnostic and prognostic biomarkers in human lung cancer. Sci. Rep. 2017;7:8072. doi: 10.1038/s41598-017-08615-5. [DOI] [PMC free article] [PubMed] [Google Scholar]
- 34.Wang Q, Chen Y, Feng H, Zhang B, Wang H. Prognostic and predictive value of HURP in nonsmall cell lung cancer. Oncol. Rep. 2018;39:1682–1692. doi: 10.3892/or.2018.6280. [DOI] [PMC free article] [PubMed] [Google Scholar]
- 35.Fragoso MC, et al. Combined expression of BUB1B, DLGAP5, and PINK1 as predictors of poor outcome in adrenocortical tumors: validation in a Brazilian cohort of adult and pediatric patients. Eur. J. Endocrinol. 2012;166:61–67. doi: 10.1530/EJE-11-0806. [DOI] [PubMed] [Google Scholar]
- 36.Chen X, et al. Defining NOTCH3 target genes in ovarian cancer. Cancer Res. 2012;72:2294–2303. doi: 10.1158/0008-5472.CAN-11-2181. [DOI] [PMC free article] [PubMed] [Google Scholar]
- 37.Zhang X, Pan Y, Fu H, Zhang J. Nucleolar and spindle associated protein 1 (NUSAP1) inhibits cell proliferation and enhances susceptibility to epirubicin in invasive breast cancer cells by regulating cyclin D kinase (CDK1) and DLGAP5 expression. Med. Sci. Monit. 2018;24:8553–8564. doi: 10.12659/MSM.910364. [DOI] [PMC free article] [PubMed] [Google Scholar]
- 38.Tagal V, et al. SMARCA4-inactivating mutations increase sensitivity to Aurora kinase A inhibitor VX-680 in non-small cell lung cancers. Nat. Commun. 2017;8:14098. doi: 10.1038/ncomms14098. [DOI] [PMC free article] [PubMed] [Google Scholar]
- 39.Horning AM, et al. Single-Cell RNA-seq reveals a subpopulation of prostate cancer cells with enhanced cell-cycle-related transcription and attenuated androgen response. Cancer Res. 2018;78:853–864. doi: 10.1158/0008-5472.CAN-17-1924. [DOI] [PMC free article] [PubMed] [Google Scholar]
- 40.Zheng F, et al. Nuclear AURKA acquires kinase-independent transactivating function to enhance breast cancer stem cell phenotype. Nat. Commun. 2016;7:10180. doi: 10.1038/ncomms10180. [DOI] [PMC free article] [PubMed] [Google Scholar]
- 41.Peng F, et al. Oncogenic AURKA-enhanced N(6)-methyladenosine modification increases DROSHA mRNA stability to transactivate STC1 in breast cancer stem-like cells. Cell Res. 2020 doi: 10.1038/s41422-020-00397-2. [DOI] [PMC free article] [PubMed] [Google Scholar]
- 42.Donnella HJ, et al. Kinome rewiring reveals AURKA limits PI3K-pathway inhibitor efficacy in breast cancer. Nat. Chem. Biol. 2018;14:768–777. doi: 10.1038/s41589-018-0081-9. [DOI] [PMC free article] [PubMed] [Google Scholar]
- 43.Melichar B, et al. Safety and activity of alisertib, an investigational aurora kinase A inhibitor, in patients with breast cancer, small-cell lung cancer, non-small-cell lung cancer, head and neck squamous-cell carcinoma, and gastro-oesophageal adenocarcinoma: a five-arm phase 2 study. Lancet Oncol. 2015;16:395–405. doi: 10.1016/S1470-2045(15)70051-3. [DOI] [PubMed] [Google Scholar]
- 44.Martinez-Chacin RC, et al. Ubiquitin chain-elongating enzyme UBE2S activates the RING E3 ligase APC/C for substrate priming. Nat. Struct. Mol. Biol. 2020;27:550–560. doi: 10.1038/s41594-020-0424-6. [DOI] [PMC free article] [PubMed] [Google Scholar]
- 45.Psyrri A, et al. Prognostic significance of UBE2C mRNA expression in high-risk early breast cancer: a hellenic cooperative oncology group (HeCOG) study. Ann. Oncol. 2012;23:1422–1427. doi: 10.1093/annonc/mdr527. [DOI] [PubMed] [Google Scholar]
- 46.Qin T, et al. Exceptionally high UBE2C expression is a unique phenomenon in basal-like type breast cancer and is regulated by BRCA1. Biomed. Pharmacother. 2017;95:649–655. doi: 10.1016/j.biopha.2017.08.095. [DOI] [PubMed] [Google Scholar]
- 47.Chou CP, et al. Ubiquitin-conjugating enzyme UBE2C is highly expressed in breast microcalcification lesions. PLoS ONE. 2014;9:e93934. doi: 10.1371/journal.pone.0093934. [DOI] [PMC free article] [PubMed] [Google Scholar]
- 48.Nam HJ, van Deursen JM. Cyclin B2 and p53 control proper timing of centrosome separation. Nat. Cell Biol. 2014;16:538–549. doi: 10.1038/ncb2952. [DOI] [PMC free article] [PubMed] [Google Scholar]
- 49.Song W, et al. Silencing PSME3 induces colorectal cancer radiosensitivity by downregulating the expression of cyclin B1 and CKD1. Exp. Biol. Med. (Maywood) 2019;244:1409–1418. doi: 10.1177/1535370219883408. [DOI] [PMC free article] [PubMed] [Google Scholar]
- 50.Li B, et al. CCNB1 affects cavernous sinus invasion in pituitary adenomas through the epithelial-mesenchymal transition. J. Transl. Med. 2019;17:336. doi: 10.1186/s12967-019-2088-8. [DOI] [PMC free article] [PubMed] [Google Scholar]
- 51.Chen G, et al. Acetylation regulates ribonucleotide reductase activity and cancer cell growth. Nat. Commun. 2019;10:3213. doi: 10.1038/s41467-019-11214-9. [DOI] [PMC free article] [PubMed] [Google Scholar]
- 52.Quan D, et al. Identification of lncRNA NEAT1/miR-21/RRM2 axis as a novel biomarker in breast cancer. J. Cell Physiol. 2020;235:3372–3381. doi: 10.1002/jcp.29225. [DOI] [PubMed] [Google Scholar]
- 53.Gandhi M, et al. The lncRNA lincNMR regulates nucleotide metabolism via a YBX1—RRM2 axis in cancer. Nat. Commun. 2020;11:3214. doi: 10.1038/s41467-020-17007-9. [DOI] [PMC free article] [PubMed] [Google Scholar]
- 54.Mazzu YZ, et al. A novel mechanism driving poor-prognosis prostate cancer: overexpression of the DNA repair gene, ribonucleotide reductase small subunit M2 (RRM2) Clin. Cancer Res. 2019;25:4480–4492. doi: 10.1158/1078-0432.CCR-18-4046. [DOI] [PMC free article] [PubMed] [Google Scholar]
- 55.Capalbo L, et al. The midbody interactome reveals unexpected roles for PP1 phosphatases in cytokinesis. Nat. Commun. 2019;10:4513. doi: 10.1038/s41467-019-12507-9. [DOI] [PMC free article] [PubMed] [Google Scholar]
- 56.Kato T, et al. Overexpression of KIF23 predicts clinical outcome in primary lung cancer patients. Lung Cancer. 2016;92:53–61. doi: 10.1016/j.lungcan.2015.11.018. [DOI] [PubMed] [Google Scholar]
- 57.Li TF, et al. Overexpression of kinesin superfamily members as prognostic biomarkers of breast cancer. Cancer Cell Int. 2020;20:123. doi: 10.1186/s12935-020-01191-1. [DOI] [PMC free article] [PubMed] [Google Scholar]
- 58.Chen J, et al. The microtubule-associated protein PRC1 promotes early recurrence of hepatocellular carcinoma in association with the Wnt/beta-catenin signalling pathway. Gut. 2016;65:1522–1534. doi: 10.1136/gutjnl-2015-310625. [DOI] [PMC free article] [PubMed] [Google Scholar]
- 59.Zhou J, et al. KIF11 functions as an oncogene and is associated with poor outcomes from breast cancer. Cancer Res. Treat. Off. J. Korean Cancer Assoc. 2019;51:1207–1221. doi: 10.4143/crt.2018.460. [DOI] [PMC free article] [PubMed] [Google Scholar]
- 60.Jiang L, et al. NCAPG confers trastuzumab resistance via activating SRC/STAT3 signaling pathway in HER2-positive breast cancer. Cell Death Dis. 2020;11:547. doi: 10.1038/s41419-020-02753-x. [DOI] [PMC free article] [PubMed] [Google Scholar]
- 61.Chen J, Qian X, He Y, Han X, Pan Y. Novel key genes in triple-negative breast cancer identified by weighted gene co-expression network analysis. J. Cell Biochem. 2019;120:16900–16912. doi: 10.1002/jcb.28948. [DOI] [PubMed] [Google Scholar]
- 62.Bayo J, et al. A comprehensive study of epigenetic alterations in hepatocellular carcinoma identifies potential therapeutic targets. J. Hepatol. 2019;71:78–90. doi: 10.1016/j.jhep.2019.03.007. [DOI] [PubMed] [Google Scholar]
- 63.Xiao C, et al. NCAPG is a promising therapeutic target across different tumor types. Front. Pharmacol. 2020;11:387. doi: 10.3389/fphar.2020.00387. [DOI] [PMC free article] [PubMed] [Google Scholar]
- 64.Ueki T, et al. Involvement of elevated expression of multiple cell-cycle regulator, DTL/RAMP (denticleless/RA-regulated nuclear matrix associated protein), in the growth of breast cancer cells. Oncogene. 2008;27:5672–5683. doi: 10.1038/onc.2008.186. [DOI] [PubMed] [Google Scholar]
- 65.Yang L, et al. Identification of a functional polymorphism within the 3'-untranslated region of denticleless E3 ubiquitin protein ligase homolog associated with survival in acral melanoma. Eur. J. Cancer. 2019;118:70–81. doi: 10.1016/j.ejca.2019.06.006. [DOI] [PubMed] [Google Scholar]
- 66.Kobayashi H, et al. Overexpression of denticleless E3 ubiquitin protein ligase homolog (DTL) is related to poor outcome in gastric carcinoma. Oncotarget. 2015;6:36615–36624. doi: 10.18632/oncotarget.5620. [DOI] [PMC free article] [PubMed] [Google Scholar]
Associated Data
This section collects any data citations, data availability statements, or supplementary materials included in this article.
Supplementary Materials
Data Availability Statement
The datasets are available from the GEO database.


