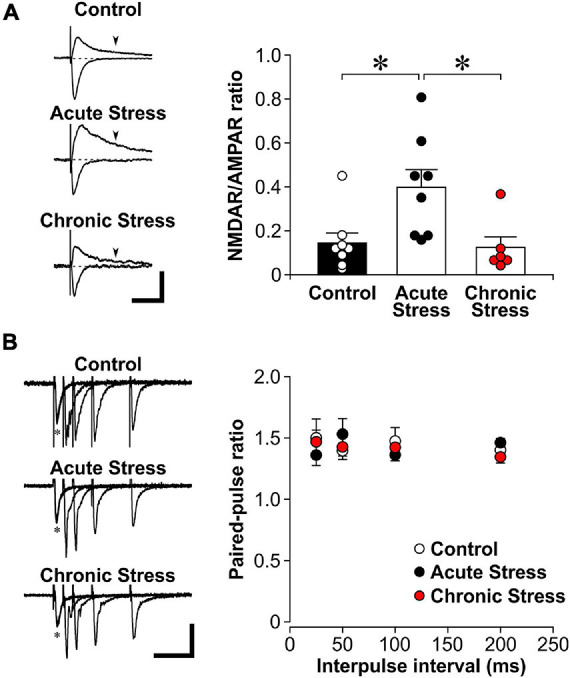
FIGURE 1.

Acute stress enhances the NMDAR/AMPAR ratio. (A) Left: Representative traces of evoked excitatory postsynaptic currents (EPSCs) while voltage clamping hippocampal CA1 neurons at either –60 mV (inward currents) or +40 mV (outward currents). The AMPAR component is represented by the EPSC amplitude recorded at –60 mV. The NMDAR component is estimated by the magnitude of +40 current at 150 ms post stimulation (arrowheads), when the AMPAR component has returned to baseline (dotted line). Scale bar = 100 pA, 100 ms. Right: Histograms of NMDAR/AMPAR ratio in EPSCs recorded from control (8 recordings, 4 rats), acutely stressed rats (8 recordings, 4 rats) and chronically stressed rats (6 recordings, 3 rats). Mean ± SEM. *p < 0.05, post hoc Wilcoxon test after Kruskal-Wallis test. (B) Left: Representative traces of paired-pulse stimulation of evoked field excitatory postsynaptic potential (fEPSP) at different interpulse intervals (*represent the first pulse, followed by the second pulse at 25, 50, 100, or 200 ms in overlapping traces) that were recorded from brain slices of control, acutely stressed and chronically stressed rats. Scale bar = 0.2 mV, 100 ms. Right: Scatter plots show the paired-pulse ratios of fEPSP slope in control (12 recordings, 5 rats), acutely stressed rats (12 recordings, 5 rats) and chronically stressed rats (15 recordings, 4 rats). Mean ± SEM.
