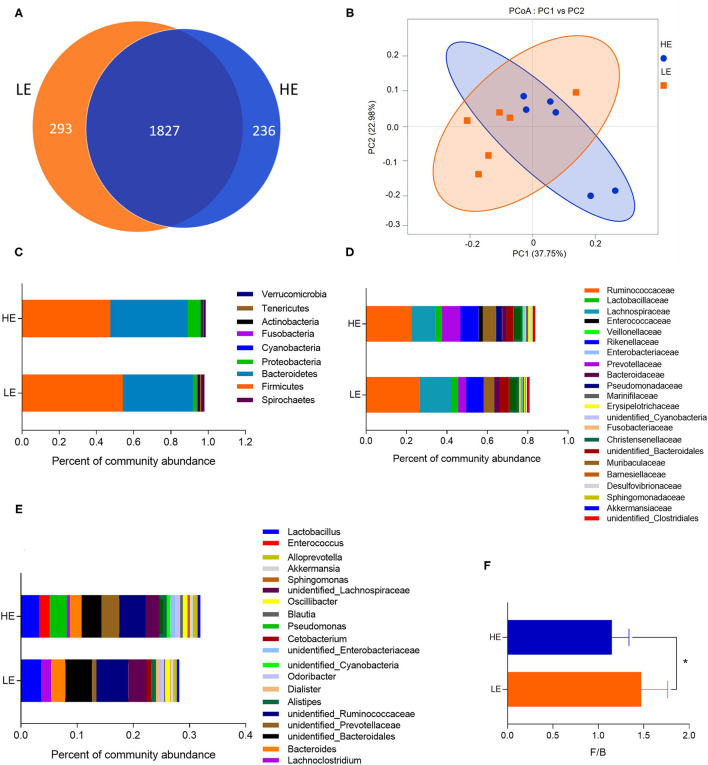
Figure 1.
The OTU numbers, beta diversity (PCoA plot), and the relative abundances at the phylum, family, and genus levels of the rectal microbiota of donkeys fed LE or HE diet. (A) Venn diagram of OTUs in the rectal microbiota; (B) principal coordinate analysis (PCoA). The relative abundances of bacteria on the right in each group at the (C) phylum, (D) family, and (E) genus levels. (F) The ratio of Firmicutes and Bacteroidetes. LE and HE represent samples collected in the rectum from donkeys fed LE or HE diet. * means significant difference between the HE and LE group (p < 0.05). Only microbes that have a mean relative abundance of more than 0.5% are displayed.

