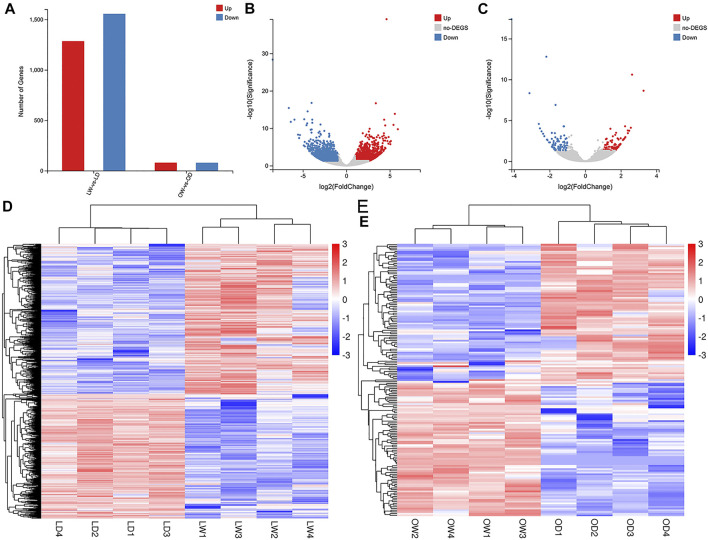
FIGURE 5.
Analysis of differently expressed genes (DEGs) between the wild and captive-reared S. o’connori. (A) Number of DEGs in liver and oocyte between the wild and captive-reared S. o’connori. Volcano plot showing the DEGs in liver (B) and oocyte (C). Hierarchical clustering of DEGs in liver (D) and oocyte (E). Each row represents a gene and each column represents a sample. Each cell in the matrix corresponds to an expression level, with blue for under-expression, red for overexpression, and white for gene expression close to the median (see color scale). LW, liver from wild S. o’connori; LD, liver from domestic S. o’connori; OW, oocyte from wild S. o’connori; OD, oocyte from domestic S. o’connori.

