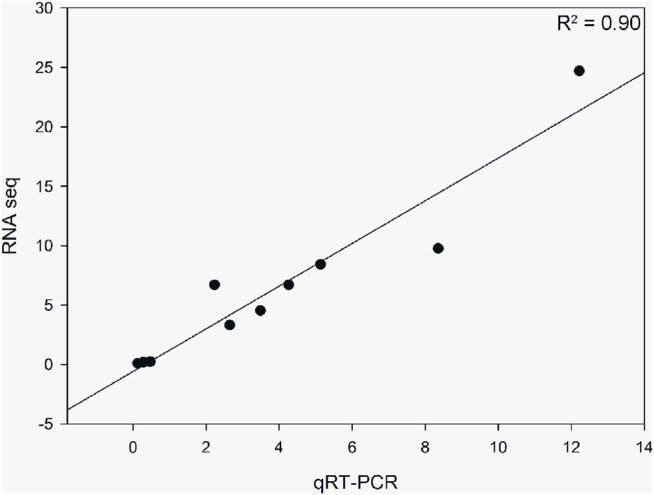
FIGURE 7.

Correlation analysis of 10 differentially expressed genes obtained from RNA-seq and qRT-PCR. The qRT-PCR values were normalized relative to the expression levels of ACTB1 in the same sample. Data are expressed as the mean of three biological replicates.
