FIGURE 8.
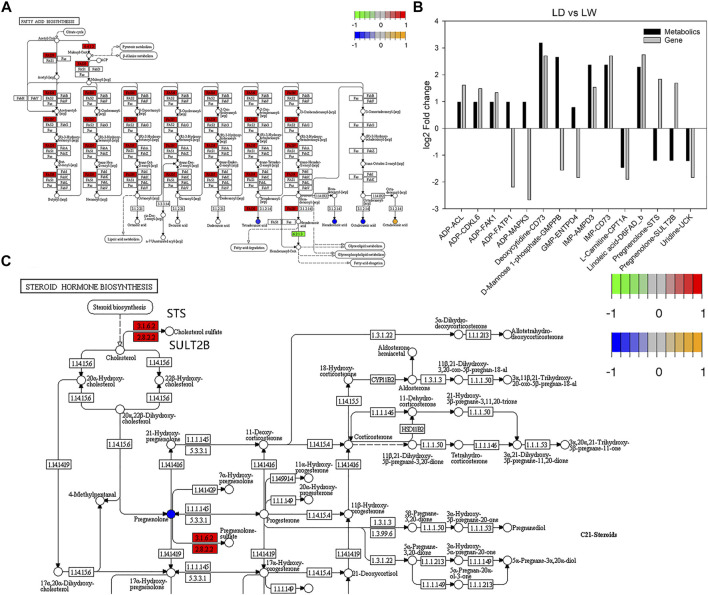
Integrated analysis of the accumulated metabolites (DAMs) and differently expressed genes (DEGs). (A) Fatty acid synthesis pathway. (B) Top 15 metabolite-gene pairs between LD and LW. (C) Part of steroid hormone biosynthesis pathway. The round nodes are metabolites, and the square nodes are the enzymes corresponding to the transcripts. The expression fold change of metabolites from low to high is represented by blue to yellow, and the expression fold change of transcripts from low to high is represented by green to red. ADP, adenosine monophosphate; GMP, guanosine 5′-monophosphate; IMP, inosine 5′-monophosphate; ACL, ATP-citrate synthase; AMPD3, AMP deaminase 3-like; CDKL6, cyclin-dependent kinase 6-like; CPT1A, carnitine O-palmitoyltransferase 1, liver isoform; D6FAD_b, delta-6 fatty acyl desaturase; ENTPD4, ectonucleoside triphosphate diphosphohydrolase 4-like; FAK1, focal adhesion kinase 1; FATP1, long-chain fatty acid transport protein 1; GMPPB, mannose-1-phosphate guanyltransferase beta; MAPK3, mitogen-activated protein kinase-activated protein kinase 3; STS, steryl-sulfatase; SULT2B, alcohol sulfotransferase; UCK, uridine-cytidine kinase; EC:2.8.2.2, SULT2B; EC:3.1.6.2, STS.

