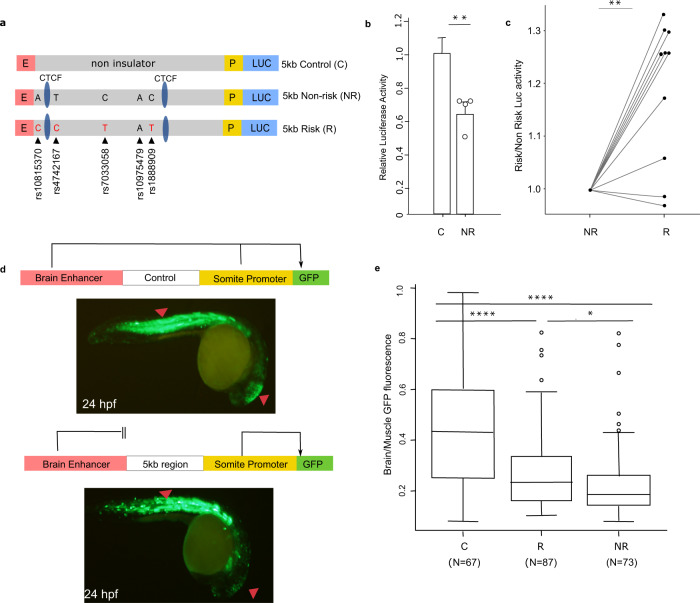
Fig. 3. Impact of the asthma-associated variants in the regulatory property of the 5 kb region.
a In vitro transgenic reporter assay. Luciferase-based enhancer barrier assay using 5 kb constructs (non-risk or risk; chr9: 6,194,675–6,199,500; hg19) that were cloned between HS2 enhancer (E) and SV40 promoter (P) sequences and transfected into K562 cells. SNPs in the construct are noted (black arrowheads). b Enhancer barrier activity of the non-risk 5 kb region of interest compared to a same size control insert (chr7: chr7: 35,303,890–35,309,030; hg19). Data are presented as mean ± SEM, n = 4 independent experiments. **p = 0.0063, one-tailed paired Student’s t-test. c Luciferase activity values of the 5 kb risk construct is shown as fold change over the activity obtained in the 5 kb non-risk sequence, n = 10 independent experiments. **p = 0.0014, two-tailed paired Student’s t-test. d In vivo zebrafish transgenic reporter assay. Green fluorescent protein (GFP) expression 24 h post fertilization (hpf) in mosaic F0 embryos injected with vectors containing a control sequence (top panel) or 5 kb interval sequence (bottom panel). e Comparison between 5 kb constructs containing risk or non-risk haplotype for enhancer-blocking property. Data are presented as the midbrain/somites EGFP intensity ratio of risk and non-risk sequences compared to empty gateway vector which has no enhancer-blocking activity (n = 67 for risk, n = 73 for non-risk, and n = 87 for control, biologically independent animals). Boxplot center line, median; box limits, upper and lower quartiles; whiskers, 1.5 × interquartile range and data beyond that threshold indicated as outliers. ****p < 0.0001; *p = 0.049, one-way ANOVA with pos hoc Holm-Sidak multiple correction test. Source data are provided as a Source Data file.

