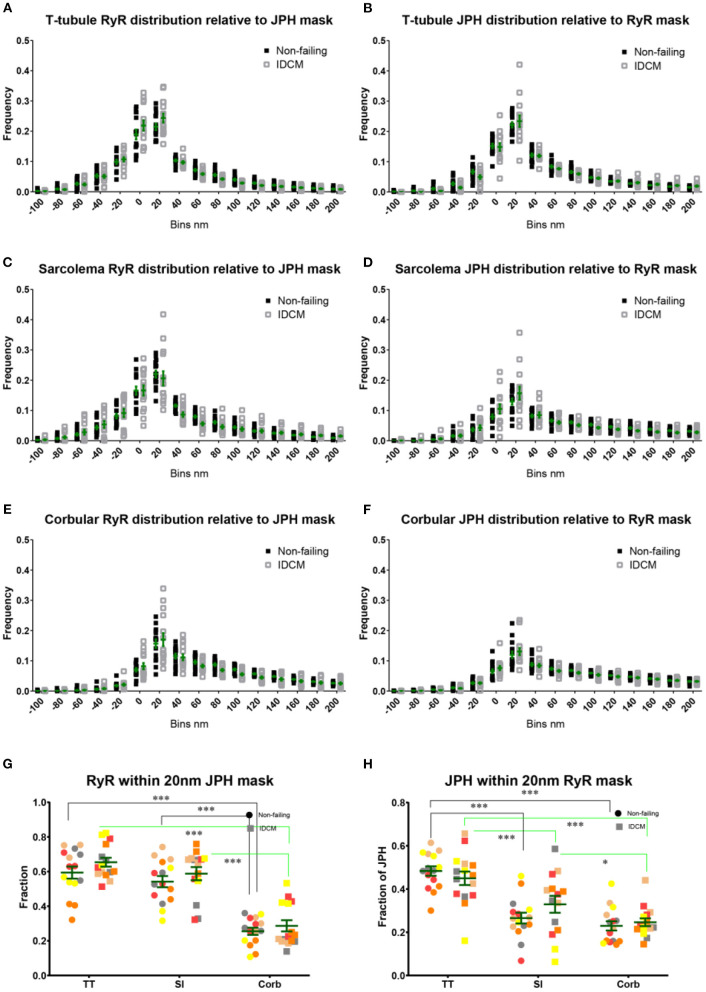
Figure 2.
Nanoscale distribution of RyR and JPH labelling in donor and IDCM human cardiac myocytes at t-tubular, sarcolemmal and corbular regions. (A) Frequency plot of RyR distribution relative to the mask of JPH labelling at the T-tubule regions. (B) Frequency plot of JPH distribution relative to the mask of RyR labelling at the T-tubule regions. (C) Frequency plot of RyR distribution relative to the mask of JPH labelling at the sarcolemmal regions. (D) Frequency plot of JPH distribution relative to the mask of RyR labelling at the sarcolemmal regions. (E) Frequency plot of RyR distribution relative to the mask of JPH labelling at the corbular SR regions. (F) Frequency plot of JPH distribution relative to the mask of RyR labelling at the corbular SR regions. (G) Total fraction of RyR with 20 nm of JPH mask for the t-tubular, sarcolemma and corbular SR regions. (H) Total fraction of JPH with 20 nm of RyR mask for the t-tubular, sarcolemma and corbular SR regions. Distributions were estimated from n = 5 donor hearts, n = 5 IDCM hearts, 3 cells were analysed from each heart. For “(G,H)” groups linked with a line are significantly different at either p < 0.05 and p < 0.001 as indicated by * and *** respectively. LME model was used to test for the effects of the disease status (IDCM, NF) and cell region (t-tubules, sarcolemma, corbular) and random effects were in the heart. P-values reported are post-hoc comparisons of marginal means using a Sidak test for multiple comparisons. Symbols of the same colour in “(G,H)” are from the same heart.

