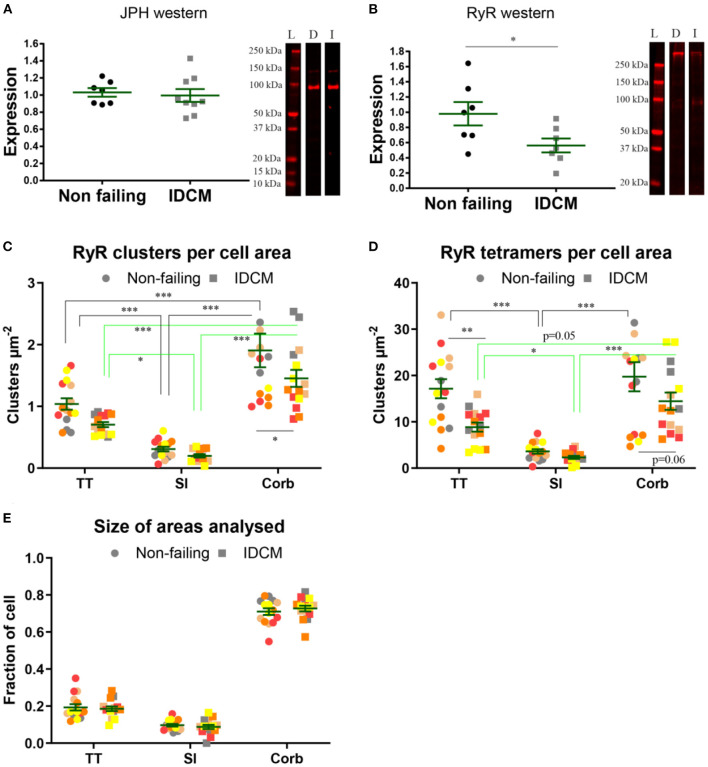
Figure 4.
Quantification of expression of JPH and RyR in normal and IDCM hearts. (A) JPH western, two-tailed t-test p = 0.79 n = 8 donor, and n = 9 IDCM hearts. (B) RyR western, two-tailed t-test p = 0.02* n = 8 donor, and n = 7 IDCM hearts. For each western exemplar, lanes are shown. L, ladder; D, donor; and I, IDCM. (C) Mean number of RyR clusters, n = 5 donor, n = 5 IDCM hearts, 3 cells were analysed from each heart. The number of clusters per cell area was calculated for TT, Sl, Corb regions. (C) Mean number of RyR clusters per cell area coming from TT, Sl, and Corb regions, n = 5 non-failing, n = 5 IDCM hearts, 3 cells were analysed from each heart. P < 0.05* for Corb. (D) Mean number of RyR tetramers per cell area coming from TT, Sl, and Corb regions, from n = 5 non-failing, n = 5 IDCM hearts, 3 cells were analysed from each heart. P < 0.05* for TT and P = 0.7 for Corb. For “(C,D)” Groups linked with a line are significantly different at either p < 0.05, p < 0.01, and p < 0.001 as indicated by *, **, and *** respectively. LME model was used to test for the effects of the disease status (IDCM, non-failing) and cell region (t-tubules, sarcolemma, corbular) and random effects were in the heart. P-values reported are post-hoc comparisons of marginal means using a Sidak test for multiple comparisons. (E) Size of the area fractions TT, Sl, and Corb analysed in “(C,D)”. Note normalisation per cell area in “(C,D)” means the number of clusters (or tetramers) per cell region, e.g., t-tubules was normalised to total cell area, as an accurate estimation of t-tubular area for normalisation was not possible from diffraction-limited confocal imaging. Symbols of the same colour in “(C–E)” are from the same heart.

