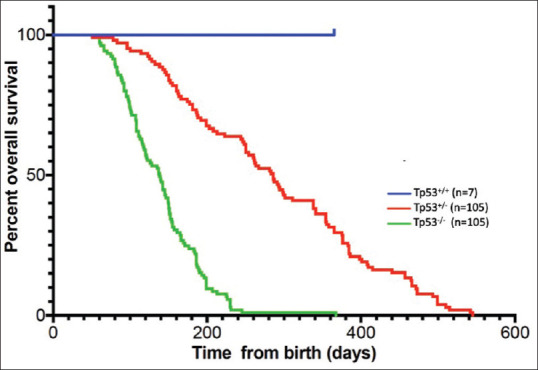
Figure 3.

Kaplan–Meier plot showing the association of TP53 genotypes with overall survival. P values were determined by log-rank test using a Bonferroni adjustment for multiple comparisons. All comparisons show statistically significant survival differences. Tp53+/+ versus Tp53+/−, P ≤ 0.05; Tp53+/+ versus Tp53−/−, P ≤ 0.001; Tp53+/− versus Tp53−/−, P ≤ 0.001
