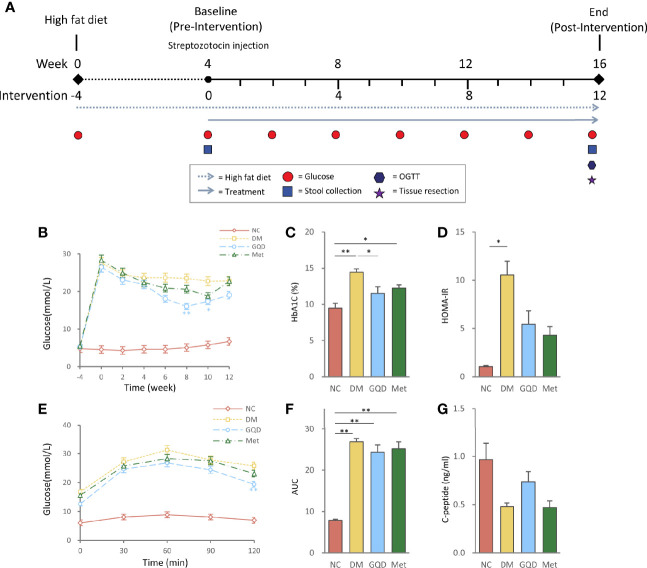
Figure 1.
Intervention of GQD decreased blood glucose, and improved oral glucose tolerance and insulin resistance status. (A) Flow diagram of the experimental design. (B) Blood glucose levels over the 12-week experiment. (C) HbA1c levels determined after treatment for 12 weeks. (D) HOMA-IR index was calculated using the following formula: HOMA-IR= FINS × FPG/22.5. (E) Oral glucose tolerance test. (F) AUC calculated from the glucose concentrations versus time for the period of 0-120 min after glucose load by the trapezoidal rule. (G) Serum C-peptide levels determined after treatment for 12 weeks. Values are expressed as means ± SE. Differences were assessed by ANOVA: **p < 0.01, *p < 0.05. HbA1c, glycosylated hemoglobin; HOMA-IR, homeostasis model assessment for insulin resistance; FINS, fasting insulin; FPG, fasting plasma glucose; NC, normal control; DM, diabetes mellitus; GQD, Gegen Qinlian Decoction; Met, metformin.

