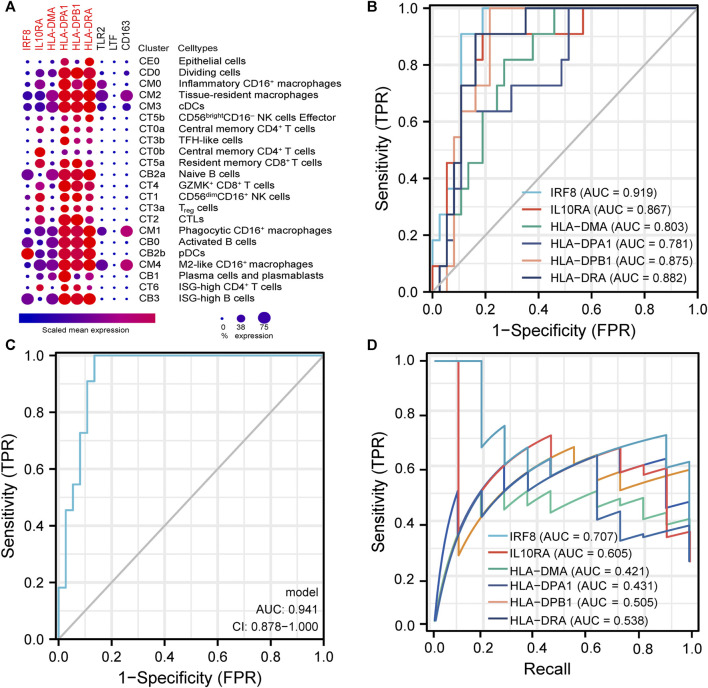
FIGURE 6.
| Analysis of immune cell distribution and diagnostic efficacy of LN biomarkers (A). Expression of co-DEGs in different immune cell types in the single cell LN sequencing database. (B) ROC curves of six differentially-expressed genes specific to LN in GSE60861. (C) ROC curve with optimal minimal gene set (IRF8, IL10RA, HLA-DMA, HLA-DPA1) in GSE60861. (D) Precision-Recall Curves of six differentially-expressed genes specific to LN in GSE60861.

